Question
Question: How do you graph \(y = \dfrac{1}{{1 + {x^2}}}\) ?...
How do you graph y=1+x21 ?
Solution
In this question, we are given an equation containing two variable unknown quantities. To plot a given equation of graph, we must know the coordinates of at least two points that lie on the curve. To find those two points we put some random values of x and get the values of y from the equation. Plotting the two obtained points and extending the line, we get the required graph.
Complete step-by-step solution:
The given function is
y=1+x21
As the numerator is equal to 1 so it is positive and the denominator is the square of a number added to 1, so the denominator is also positive. Thus the value of y for any value of x comes out to be positive and x can take any real number as its value.
As the value of the denominator decreases, the value of y will increase, so the value of y is maximum when x=0.
As the value of x increases or decreases, the square of x will increase either way and thus the value of the 1+x2 increases and value of y=1+x21 decreases.
Hence, the graph of the function y=1+x21is given as –
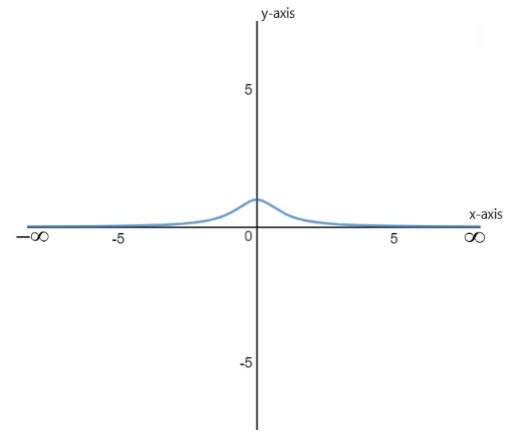
Note: We see that in this equation the left side contains only ”y” and the right side contains the ratio of 1 and 1+x2 , that is, in this equation y is expressed in terms of x, thus the given equation is a function in terms of x. As the value of x changes the value of y also changes. So, x is called the independent variable and y is called the dependent variable.