Question
Question: How do you graph \(y = \cot x + 2\)?...
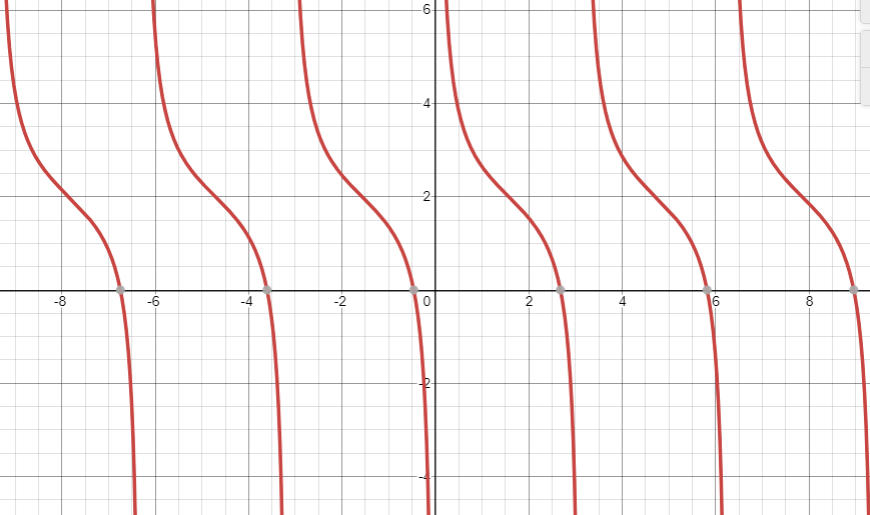
How do you graph y=cotx+2?
Solution
This problem deals with plotting the given equation which is in a trigonometric form of function. Here the graph of the given equation is plotted by taking one step at a time that is, by considering the value of the variable x to be varying and hence finding the corresponding values of y to plot the desired resulting graph.
Complete step by step solution:
Given that a function which varies with the variable x, is actually an equation in terms of trigonometric function.
The given equation is y=cotx+2.
Now consider the given equation as shown below:
⇒y=cotx+2
Now plotting the given equation in a graph by considering the value of x and y, as shown below:
For the value of x=0, the value of y is given by substituting the value of x in the given equation.
⇒y=cot(0)+2
We know that cotx=∞ when x=0, so when x approaches zero, cotx approaches infinity.
At x=0, y=∞.
For the value of x=4π, the value of y is given by substituting the value of x in the given equation.
⇒y=cot(4π)+2
We know that cot(4π)=1 when x=4π.
⇒y=1+2
Atx=4π, y=3
For the value of x=π, the value of y is given by substituting the value of x in the given equation.
⇒y=cot(π)+2
We know that cotx=∞ when x=π, so when x approaches π, cotx approaches infinity.
At x=π, y=∞.
And hence this keeps on repeating for every cycle. Now with this help we can plot the graph of the given equation which is y=cotx+2, as shown below:
Note: Please note that the above problem is solved by plotting the given equation which is given by y=cotx+2, here this can also be done by considering the value of the function cotx to be f(x).
So here first we can plot y=f(x) and then add 2, still getting the same plot.