Question
Question: How do you graph \[y = \cot x\]?...
How do you graph y=cotx?
Solution
We need to graph the given function. We will use the domain and some values of x lying between −2π and 2π to find some values of y. Then, we will observe the behavior of the value of y, and use it and the coordinates obtained to graph the function.
Complete step-by-step solution:
The domain of the function y=cotx is given by \left\\{ {x:x \in R{\rm{ and }}x \ne n\pi ,n \in Z} \right\\}. This means that the cotangent of any multiple of π does not exist.
The graph of the cotangent function reaches arbitrarily large positive or negative values at these multiples of π.
Now, we will find some values of y for some values of x lying between −2π and 2π.
Substituting x=−23π in the function y=cotx, we get
y=cot(−23π) ⇒y=0
Substituting x=−2π in the function y=cotx, we get
y=cot(−2π) ⇒y=0
Substituting x=2π in the function y=cotx, we get
y=cot(2π) ⇒y=0
Substituting x=23π in the function y=cotx, we get
y=cot(23π) ⇒y=0
The value of y at x=2π,π,0,π,2π is infinite.
Arranging the values of x and y in a table and writing the coordinates, we get
| x | y |
|---|---|
| −2π | ∞ |
| −23π | 0 |
| −π | ∞ |
| −2π | 0 |
| 0 | ∞ |
| 2π | 0 |
| π | ∞ |
| 23π | 0 |
| 2π | ∞ |
The value of y=cotx decreases from ∞ to 0 at x=−23π, and then to −∞ in the interval (−2π,−π).
Similarly, the value of y=cotx decreases from ∞ to 0 at x=−2π,2π,23π, and then to −∞ in the intervals (−π,0), (0,π), and (π,2π).
Now, we will use the points (−23π,0), (−2π,0), (2π,0), (23π,0) and the behaviour of the value of y=cotx to graph the function.
Therefore, we get the graph
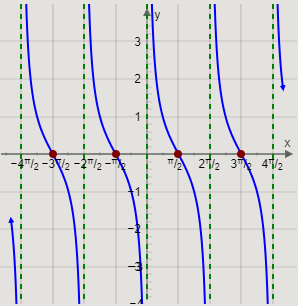
This is the required graph of the function y=cotx.
Note:
The period of the function y=cotx is π. This means that the graph of y=cotx will repeat for every π distance on the x-axis. It can be observed that the pattern and shape of the graph of y=cotx is the same from −2π to −π, from −π to 0, from 0 to π, and from π to 2π. The range of cotangent functions is from −∞ to ∞. As tangent function is a reciprocal function cotangent function, so their graph faces opposite to each other.