Question
Question: How do you graph \(y = - \cot \left( {\pi \cdot x} \right)\) ?...
How do you graph y=−cot(π⋅x) ?
Solution
To draw the graph of the given function, we first need to draw the graph of y=cotx .
Now, the two differences between the graphs of cotx and −cot(π⋅x) are the points where they are zero and the negative sign due to which the nature of the graph will change.
So, first we’ll try to find the points where the graph of −cot(π⋅x) is defined and zero. Then, draw the graph.
Complete step-by-step answer:
Given the function y=−cot(π⋅x) and we need to draw the graph of this function.
First, we’ll see the points where y=cotx is defined.
y=cotx is defined except at the x=0,π,2π,3π,...
Using these points, we can find the points where y=−cot(π⋅x) is defined.
Dividing both sides by π , we get, x=π0,ππ,π2π,π3π,...
So, the points are x=0,1,2,3,...
Now, we know the points where y=cotx is zero i.e., x=2π,23π,25π,27π,...
Using these points, we can find the points where y=−cot(π⋅x) is zero.
We have, π⋅x=2π,23π,25π,27π,... , Dividing both sides by π , we get, x=21,23,25,27,... .
So, y=−cot(π⋅x) is zero when x=21,23,25,27,... .
Now, we know the graph of y=cotx is as follows:
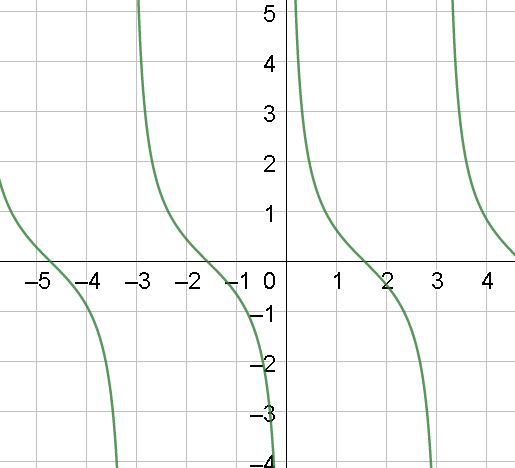
From the graph, it is clear that y=cotx is not defined when x=0,π,2π,3π,... and is zero when x=2π,23π,25π,27π,... . Now, let’s draw the graph of y=cot(π⋅x) which will have the same nature as that of y=cotx but the points where it is defined and where it is zero will change.
The graph of y=cot(π⋅x) will be
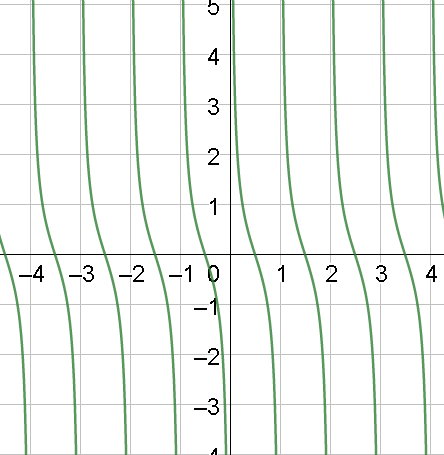
Clearly, the curve is not defined when x=0,1,2,3,... and zero when x=21,23,25,27,... .
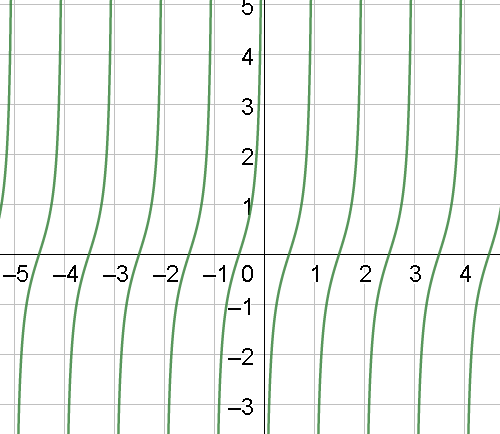
Now, the graph y=−cot(π⋅x) will get reversed due to the negative sign.
Hence, the graph of y=−cot(π⋅x) will be
Note: The points to be remembered while drawing the graph of the given curve are
The angle π⋅x which is not just x , due to which the points where cot(π⋅x) is defined and is zero will change.
And the negative sign due to which the curve gets reversed i.e., the nature of the curve will get reversed.
For graphing a complex trigonometric function, we must know the graphs of the basic trigonometric functions, which makes it easier to draw the curve of any other trigonometric function.