Question
Question: How do you graph \[y = \cos x + 3\]?...
How do you graph y=cosx+3?
Solution
We need to graph the function y=cosx+3. On observing this function, we see that this function is of the form y=f(x)+a, where a is a constant. To sketch the graph of such functions, we first sketch the graph of y=f(x). Now, since a is added to the term, the graph of y=f(x) when shifted a units upward, gives the graph of y=f(x)+a. Let us now use this procedure to sketch the graph of the given function.
Complete step by step answer:
We need to sketch the graph of the function y=cosx+3.
Comparing y=cosx+3 with y=f(x)+a, we get
⇒f(x)=cosx
⇒a=3
Now, to sketch the graph of y=cosx+3, we first sketch the graph of y=cosx.
Let us sketch the graph of y=cosx.
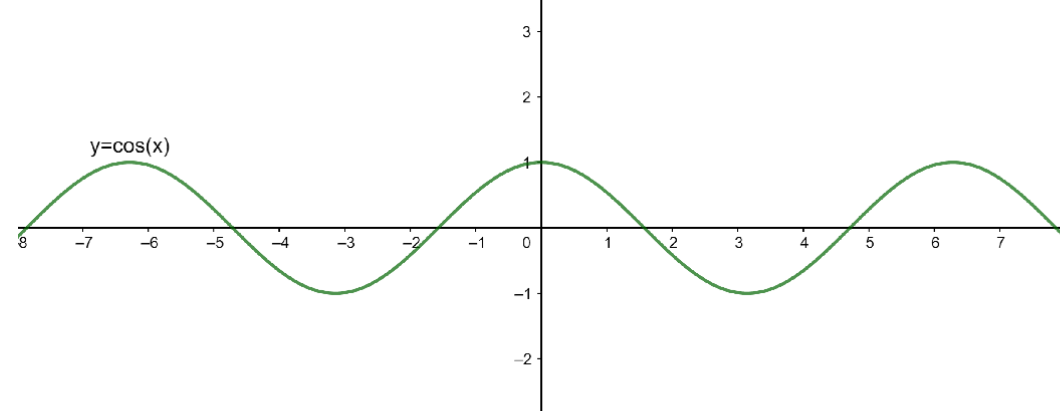
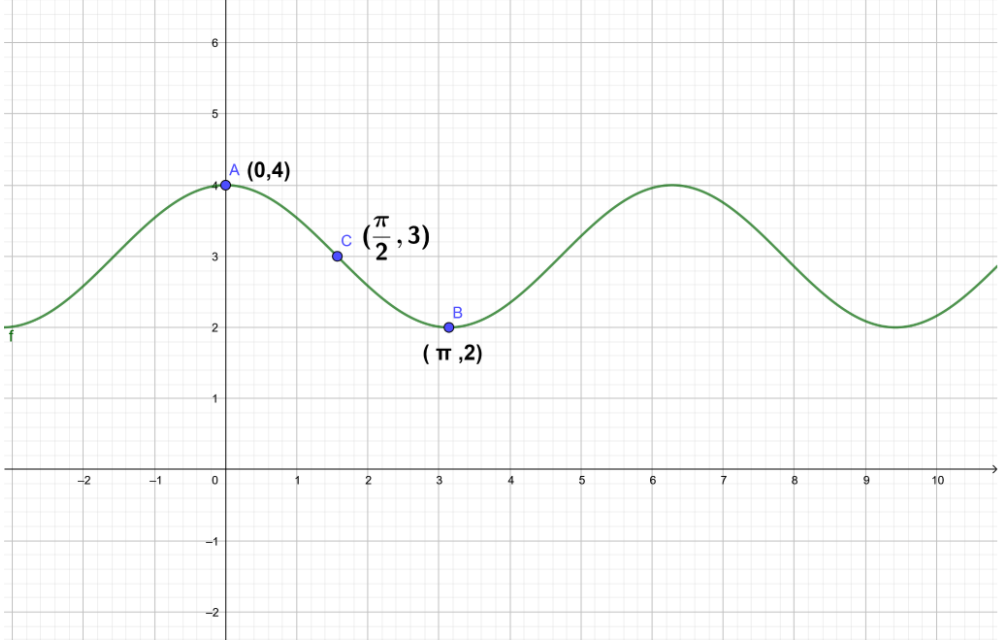
The above graph is for the function y=cosx but we need to sketch the graph of y=cosx+3.Now, since a=3, we need to shift the graph of y=cosx three units upwards.Shifting the graph three units upward, we get the following graph
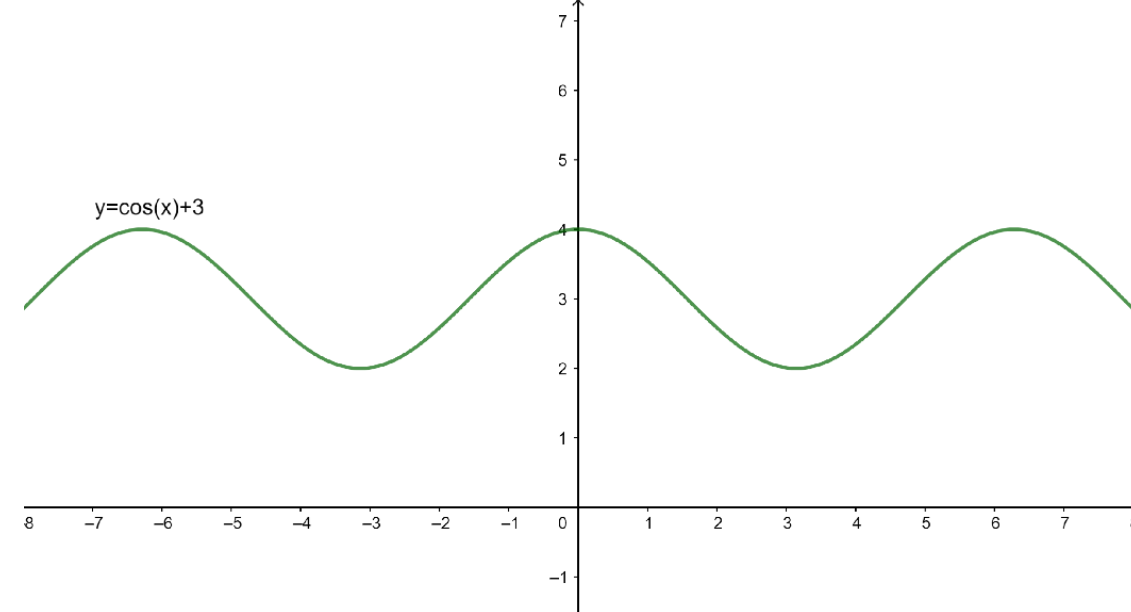
The graph obtained by shifting the graph of y=cosx three units upward is the graph of the function y=cosx+3. Hence, the graph above is the required graph.
Note: We can also sketch the graph directly by putting the values of x and obtaining the corresponding values of y, then joining the points on the cartesian plane and obtaining the required graph. If we were given the function of the form y=f(x)−a, where a is a constant, then we need to shift the graph of y=f(x) downward by a units.
For example: Let us assume the value of x as zero. Then, we have,
y=cos(0)+3
We know that the value of cos(0) is 1. So, we get,
⇒y=1+3
⇒y=4
Similarly, if value of x is π, we get,
y=cos(π)+3
We know that the value of cos(π) is (−1). So, we get,
⇒y=−1+3
⇒y=2
For x equals (2π), we have,
y=cos(2π)+3
We know that the value of cos(2π) is zero. So, we get,
⇒y=0+3
⇒y=3
Hence,we plot these points on the graph and join to get the graphical representation of the given function.