Question
Question: How do you graph \(y = \cos x + 3\)?...
How do you graph y=cosx+3?
Solution
In order to graph the above trigonometric function, first draw the graph of the cosine function. Use the fact that there is a number in the end of cosine function, then there will always be a Vertical shift. If the number is positive, then Vertical Shift Up Else Vertical Shift Down. In our case the number is 3 so there is a Vertical Shift Up three unit.
Complete step by step answer:
We are given a trigonometric function i.e. y=cosx+3
Recall that the domain of cosine function is in the interval [0,π] and the range of the same is in the interval [−1,1].
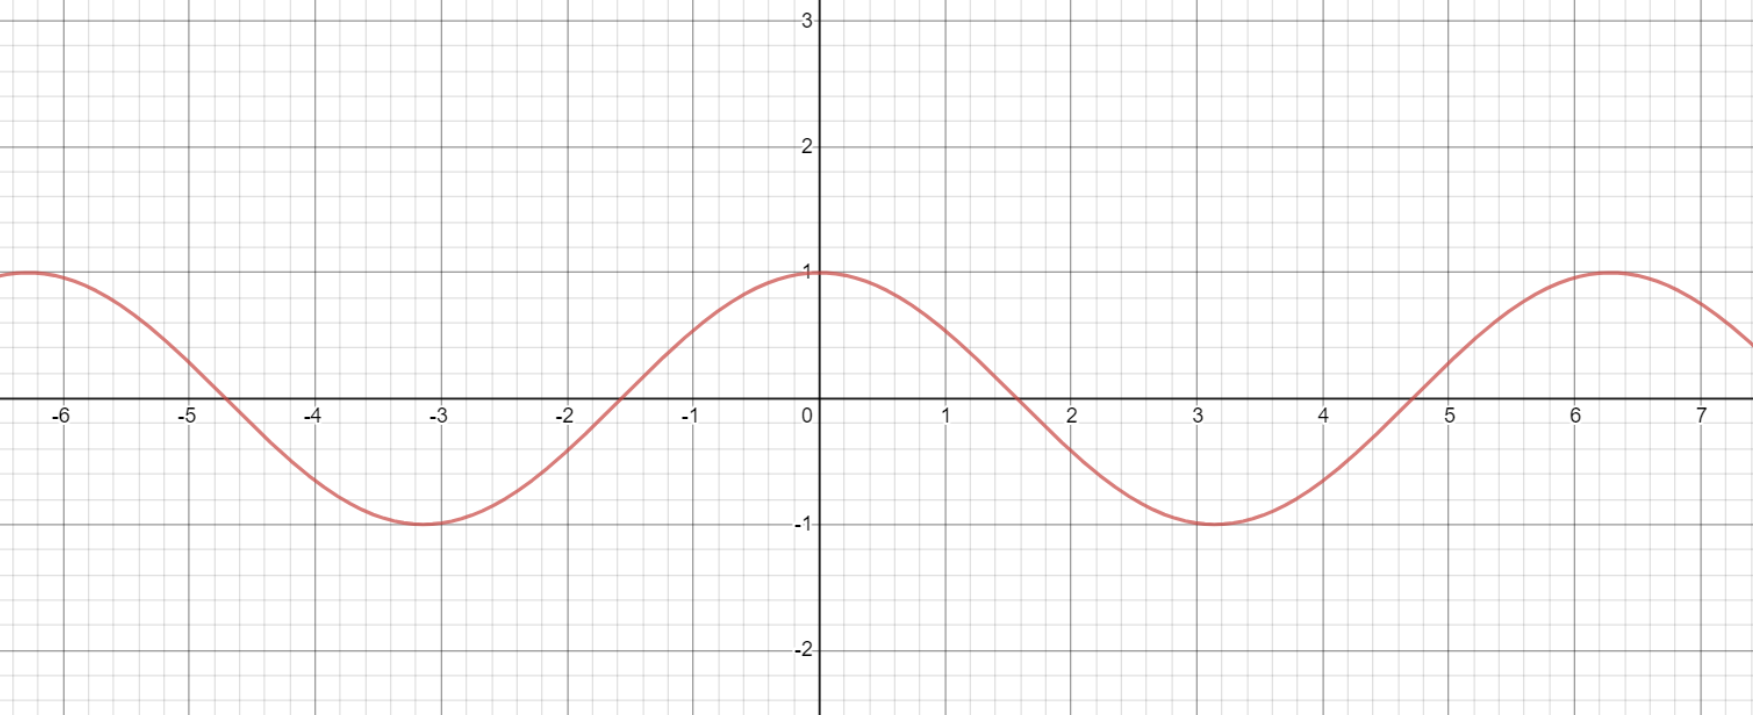
Lets first draw the graph of cosine function y=cosx
If you add any number on the end of the cosine function, then there will always be a vertical shift of the graph. When the number is positive then there will be a vertical Shift up and if the number is negative then Vertical shift down.
In our case, the number is positive i.e. 3 so the graph will have a Vertical Shift Up three units, which gives the following graph :
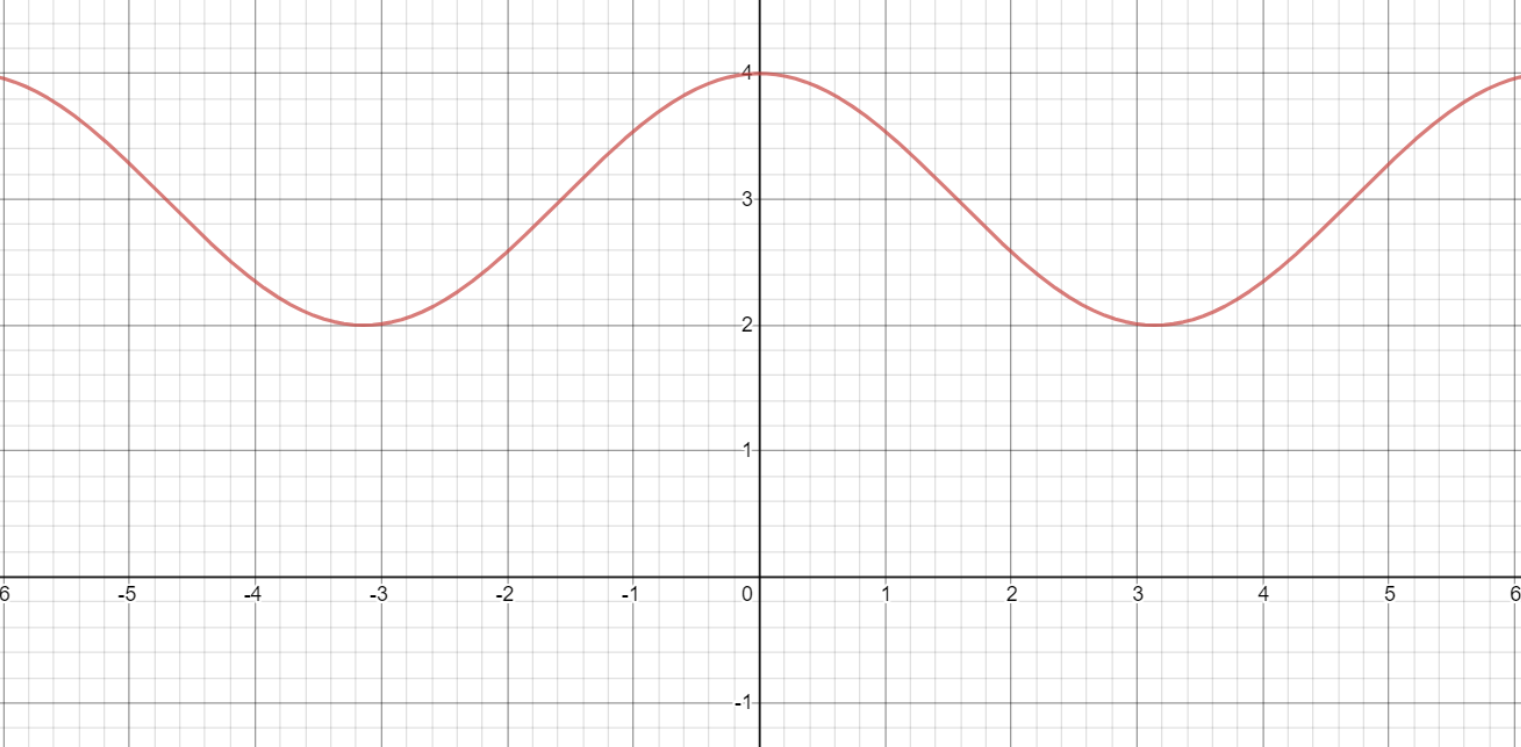
Hence, we’ve successfully plotted our graph of equationy=cosx+3
Note: 1.Draw the cartesian plane only with the help of straight ruler and pencil to get the perfect and accurate results.
2.Mark the points carefully.
3. x-intercept is the point at which the line intersects the x-axis of the plane and similarly y-intercept is the point at which line intersects the y-axis of the plane.