Question
Question: How do you graph \(y=-\cos x-1\)?...
How do you graph y=−cosx−1?
Solution
We first try to plot the graph for y=cosx. Then we take the mirror image of the given graph for the y=−cosx. The respective line is the X-axis. Then we find the graph for y=−cosx−1 by lowering the graph line of y=−cosx by 1 unit.
Complete step-by-step answer:
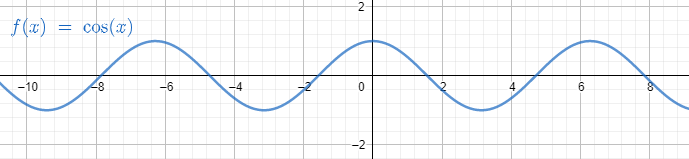
The usual common graph which is easier to plot on the graph is y=cosx.
The graph is an oscillating graph with boundary being −1 and 1.
The domain for the graph y=cosx is ∀x∈R.
The range for the graph y=cosx is [−1,1].
Now depending on the above-mentioned graph, we are going to first find the graph of
y=−cosx and then find the graph of y=−cosx−1.
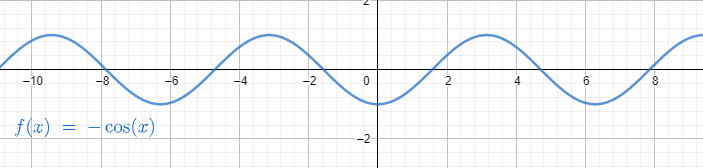
The change between y=cosx and y=−cosx is that for a particular value of x, we are going to find the value of y being the opposite sign of each other.
This means that we are going to mirror the graph with respect to the line y=0 which is the X-axis at the time of changing the graph from y=cosx to y=−cosx.
The domain for the graph y=−cosx is ∀x∈R.
The range for the graph y=−cosx is [−1,1].
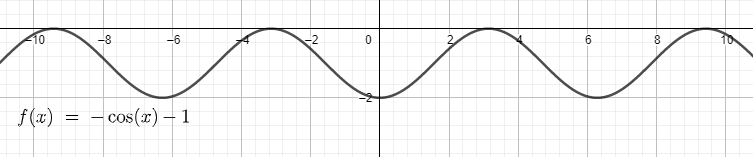
The change between y=−cosx and y=−cosx−1 is that for a particular value of x, we are going to find the value of y being 1 less than the previous value for y=−cosx.
This means that we are going to lower the graph with respect to the previous graph line which is for y=−cosx at the time of changing the graph from y=−cosx to y=−cosx−1.
The domain for the graph y=−cosx−1 is ∀x∈R.
The range for the graph y=−cosx−1 is [−2,0].
Note: We need to be careful about the change from y=−cosx to y=−cosx−1. The lowering or ascending of the graph is dependent on the constant value that is being added. If the value is positive then graph ascends and if the value is negative then it descends.