Question
Question: How do you graph \(y=\cos \left( \dfrac{1}{2}x \right)+1\)?...
How do you graph y=cos(21x)+1?
Solution
First compare the function y=cos(21x)+1 with the base function. Find the amplitude, period, phase shift and vertical shift of the function. Then take some different ‘y’ values for corresponding ‘x’ values and plot the graph.
Complete step by step solution:
y=cos(21x)+1 is a trigonometric function of the base function y=cosx.
It can be compared to the extended form of the base function acos(bx−c)+d, where ‘a’ is the amplitude, ‘b’ is used to find the period, ‘c’ is used to find the phase shift and ‘d’ is the vertical shift.
By comparing, we get
Amplitude a=1
b=21
As we know, period=∣b∣2π
So, period=212π=2π×12=4π
c=0
Again as we know phase shift=bc
So, phase shift=210=0×12=0
Vertical shift d=1
For the graph we have to take some different values of ‘y’ for corresponding ‘x’ values
| x | 0 | π | 2π | 3π | 4π |
|---|---|---|---|---|---|
| y | 2 | 1 | 0 | 1 | 2 |
Taking these values of ‘x’ and ‘y’ the graph can be drawn as
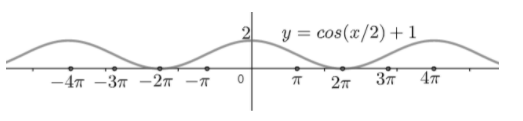
Note:
The base function of y=cos(21x)+1 is y=cosx. From the above graph we can conclude that the standard graph of cosx is shifted up 1 unit on the positive ‘y’- axis with a period, which is extended to 4π. As we know the frequency is the reciprocal of period, so the frequency of the above function will be=period1=4π1.