Question
Question: How do you graph \(y+9=-3x\) and find the intercepts?...
How do you graph y+9=−3x and find the intercepts?
Solution
As we know that slope intercept form of a line is given as y=mx+c where c is the y-intercept. To find the x intercept we will put the value of y equal to zero in the equation. Then we plot a graph by using the points of x intercept and y intercept.
Complete step-by-step solution:
We have been given an equation of line y+9=−3x.
We have to plot a graph and find the intercepts.
We know that the general form of slope intercept form of a line is given as y=mx+c where, m is the slope and c is the y-intercept.
Now, we can rewrite the given equation as y=−3x−9
Now, comparing the above equation with the general form we will get
m=−3 and c=−9
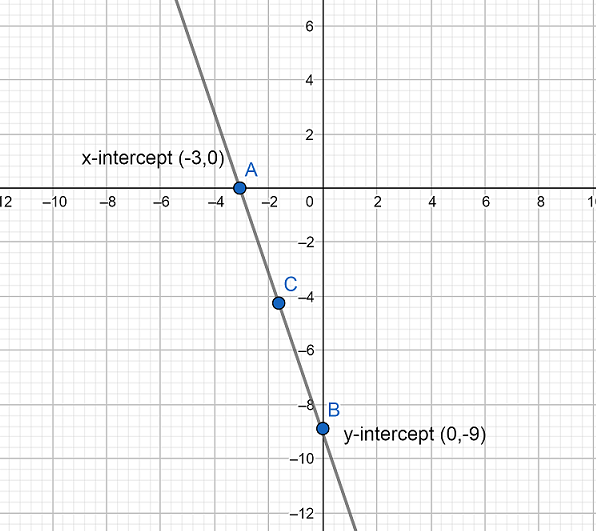
So we get that the y intercept is at point (0,−9).
Now, we know that for x-intercept y=0
Now, substituting the value of y in the given equation we will get
⇒0+9=−3x
Simplifying the above obtained equation we will get
⇒9=−3x⇒x=−39⇒x=−3
So we get that the x intercept is at point (−3,0).
Hence we get the x intercept and y intercept as −3,−9 respectively.
Now, we can plot a graph by using the points (−3,0) and (0,−9). Then we will get
Note: Students can find the other points also to easily plot a graph by substituting the value as x=1 in the given equation. Be careful while plotting the graph. Plot correct points and consider signs also, plot accordingly. Also remember the point that for x intercept the value of y is zero and for y intercept the value of x is zero.