Question
Question: How do you graph \[y = 6\sin x\] ?...
How do you graph y=6sinx ?
Solution
Hint : In this question, we have to plot the graph of the given sine function. We have to first convert any function to the standard form for plotting the graph of that function, and then we compare it with the standard equation. This way we can find out how the graph should be plotted. The standard form of the sine equation is y=Asin(Bx+C)+D .
Complete step-by-step answer :
We are given that y=6sinx and we know that the standard form is y=Asin(Bx+C)+D ,
Comparing these two equations, we get –
A=6,B=1,C=0andD=0
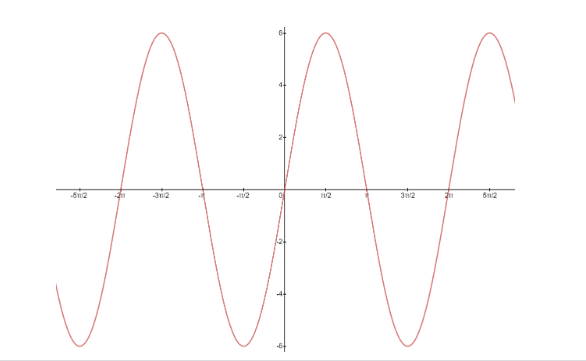
Thus, the given sine function has peak values at 6 and -6, that is, it oscillates between 6 and -6 and the given sine function completes one oscillations between 0 and 2π , but for plotting the graph, we have to find out the period of the function. Period of a sine function is –
p=B2π ⇒p=12π=2π
That is the given function repeats the oscillation after every 2π radians, it completes 1 oscillation in the interval 0 to 2π .
Now, We know all the quantities for plotting the graph of the given function, so the graph of y=6sinx is plotted as follows –
Note : We know that the general form of the sine function is y=Asin(Bx+C)+D where
A is the amplitude, that is, A tells us the value of the peaks of the function.
B is the frequency, that is, B tells us the number of oscillations a function does in a fixed interval.
C and D denote the horizontal and vertical shift of a function respectively. The value of C and D is zero for the given function, so there is no horizontal or vertical shift.