Question
Question: How do you graph \( y = - 6 + 2x \) using the intercepts?...
How do you graph y=−6+2x using the intercepts?
Solution
Hint : As we can see that we have an equation and it is a linear equation in two variables. We need to plot a graph for the given equation, For plotting a graph we need different x value as well as y value. So we need to find the values by substituting y=0 and x=0 respectively, after these we need to plot these on the graph.
Complete step by step solution:
According to the question we have the equation y=−6+2x .
We will first determine the x intercept by putting y=0 , So we have 0=2x−6 .
By adding both the sides by 6 we have,
0+6=2x−6+6⇒6=2x , So we have the value of x=26=3 .
So we have the x intercept (x,y)=(3,0) .
Now we will determine the y− intercept, this time we substitute the value =0 , so we have y=2(0)−6⇒y=−6 . Hence the y− intercept is (x,y)=(0,−6) .
Now we will put them into graph:
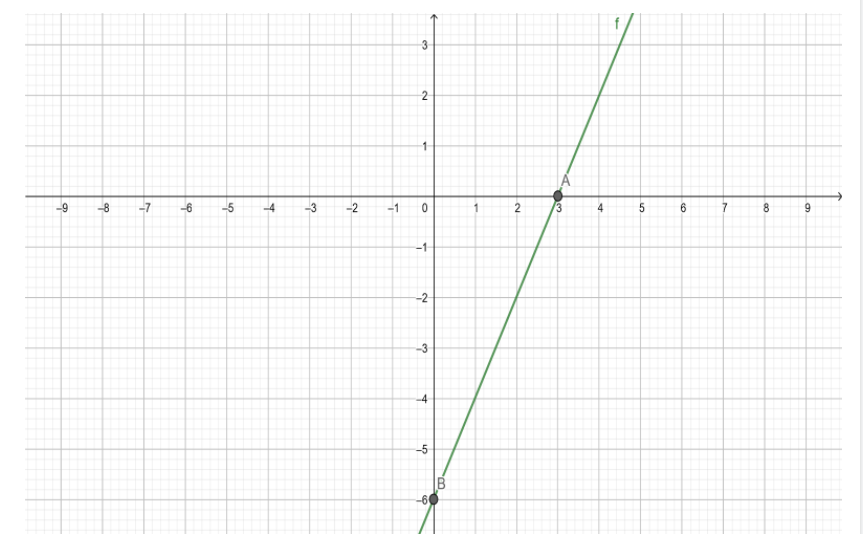
Hence in the above figure we have point A (3,0) and point B (0,−6) .
Note : Before solving this kind of question we should be aware of the x and y axis and how to plot their values. The calculations should be done carefully to avoid calculation mistakes because it will create a wrong graph. We should note that the above equation is a linear equation so the graph is always a straight line.