Question
Question: How do you graph \[y - 5x = 0\] by plotting points?...
How do you graph y−5x=0 by plotting points?
Solution
We use the given equation of line. Substitute the value of ‘x’ and calculate the corresponding value of ‘y’ from the equation. Similarly, we can substitute values for ‘y’ and calculate the corresponding values for ‘x’ using the equation.
Complete Step by Step Solution:
We have equation of line y−5x=0 … (1)
We can shift 5x to the right hand side of the equation and change the sign of the value when shifting it from one side of the equation to another.
⇒y=5x … (2)
We will substitute the value of ‘x’ in the right hand side of equation (2) and calculate the corresponding value of ‘y’.
Put x=0, then y=5×0=0
Point becomes (0,0)
Now, if we put x=1, then y=5×1=5
Point becomes (1,5)
Now, if we put x=2, then y=5×2=10
Point becomes (2,10)
Now we plot the points (0,0), (1,5)and (2,10) on the graph.
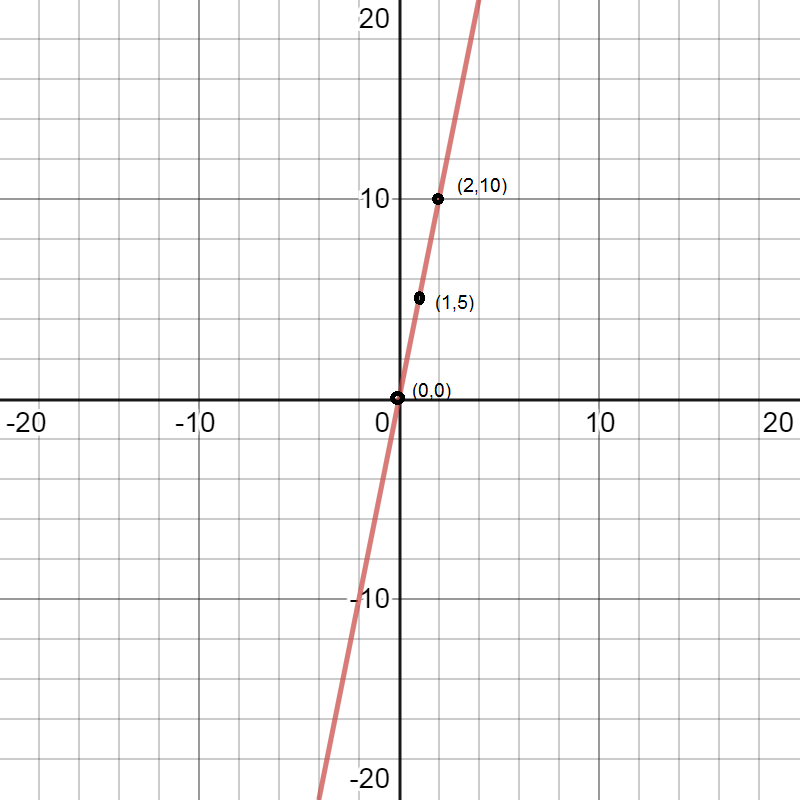
∴The graph of the equation y−5x=0 can be made by plotting the points (0,0), (1,5)and (2,10)and joining the line through these three points.

Note:
Students are likely to make mistakes while shifting the values from one side of the equation to another side of the equation as they forget to change the sign of the value shifted. Keep in mind we always change the sign of the value from positive to negative and vice versa when shifting values from one side of the equation to another side of the equation. When plotting the points on the graph many students tend to mark wrong points due to the scale, keep in mind we can adjust the scale of the graph according to our need.