Question
Question: How do you graph \(y-5=3\left( x-1 \right)\)?...
How do you graph y−5=3(x−1)?
Solution
In this question we have been given a linear equation which we will re-arrange and simplify the like terms to convert the expression into the equation of line which is y=mx+c, where m is the slope of the line and c is the y-intercept. We will then use the equation and plot the line on the graph.
Complete step by step solution:
We have the expression as:
⇒y−5=3(x−1)
On transferring the term −5 from the left-hand side to the right-hand side, we get:
⇒y=3(x−1)+5
On expanding the brackets in the right-hand side, we get:
⇒y=3x−3+5
On simplifying the terms, we get:
⇒y=3x+2
Now, we can see that the above expression is in the form of the equation of a line which is y=mx+c.
On comparing it we get the slope of the line m=3 and the y-intercept as 2.
Therefore, the points on the y-axis through which the line passes is (0,2)
Now the x-intercept can be calculated by keeping the value of y=0 and solving for the value of x.
On substituting, we get:
⇒0=3x+2
On transferring the term 2 from the right-hand side to the left-hand side, we get:
3x=−2
On transferring the term 3 from the right-hand side to the left-hand side, we get:
x=3−2
On simplifying, we get:
x=−0.66.
Therefore, the point on the x-axis through which the line passes is (−0.66,0)
On plotting the points (0,2) and (−0.66,0), and joining both the points, we get:
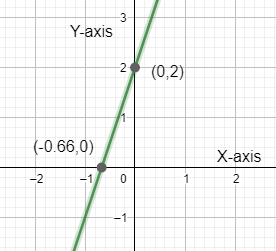
Which is the required graph for the line y=3x+2.
Note: It is to be remembered that m is the slope of line which tells us the inclination of the steepness of the line. The slope of the line is also called the gradient of the line. In this equation we had the expression in the form of a linear expression which is why we tried to convert it into the equation of line, if the equation had a power, try converting it into the equation of a circle or an ellipse.