Question
Question: How do you graph \(y=4\csc 2x\)?...
How do you graph y=4csc2x?
Solution
First compare the function y=4csc2x with the base function. Find the period and frequency of the function. Then take some different ‘y’ values for corresponding ‘x’ values and plot the graph.
Complete step-by-step solution:
y=4csc2x is a trigonometric function of the base function y=cscx.
As we know cscx is the reciprocal of sinx, so cscx will not be defined at the points where sinx is 0. Hence, the domain of cscx will be R−nπ, where ‘R’ is the set of real numbers and ‘n’ is an Integers. Similarly, the range of cosec x will be R−(−1,1). Since, sinx lies between (−1,1), so cscx can never lie in the region of (−1,1).
Now, considering our equation y=4csc2x
Here the range of the function will be 4 times from that of y=cscx
Again as we know the period of cscx=2π, so the period of y=4csc2x will be=∣2∣2π=π
And the frequency=π1 (as frequency is the reciprocal of time period)
For the graph we have to take some different values of ‘y’ for corresponding ‘x’ values
| x | 4π | 43π | 45π | 47π | 49π |
|---|---|---|---|---|---|
| y | 4 | −4 | 4 | −4 | 4 |
Taking these values of ‘x’ and ‘y’ the graph can be drawn as
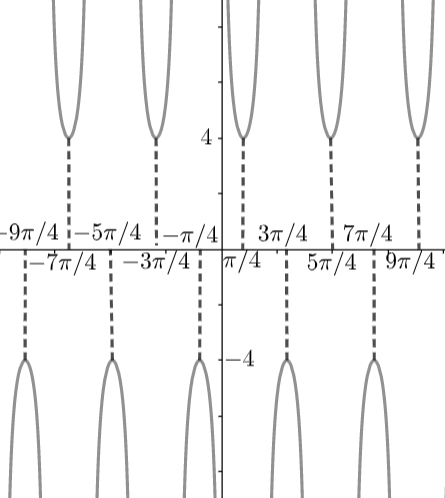
Note: The base function of y=4csc2x is y=cscx. From the above graph, we can conclude that the graph of the function cscx does not have a maximum or a minimum value. The function goes to infinity periodically and is symmetric with the origin.