Question
Question: How do you graph \(y = 3x - 7?\)...
How do you graph y=3x−7?
Solution
Whenever they ask us to draw a graph for a straight line equation we need to have a minimum of two points, it may be intercept points or any other point. We can get the points by substituting or assuming different values for x and finding the corresponding values of y. By using these points we can plot the graph for the given equation.
Complete step by step answer:
The given equation y=3x−7 is a straight line equation, where we need to have a minimum of two points to plot a graph. The two points may be intercepts that are x-intercept and y-intercept which means x-intercept is a point that passes the x-axis at y=0 and the y-intercept is a point that passes the y-axis at x=0. We can also find the point by taking different values for x and finding the corresponding values of y by substituting them back in the equation.
Now, we find the y-intercept by putting x=0 in the equation y=3x−7
Therefore we get, y=3×0−7
⇒y=−7 at x=0
Now, we find the x-intercept by putting y=0 in the equation y=3x−7
Therefore we get, 0=3x−7
⇒3x=7
⇒x=37=2.333 at y=0
For better understanding, we take some more points for x and find the corresponding values of y.
Let us substitute x=1 in the equation y=3x−7, we get
y=3×1−7
⇒y=3−7=−4
Now, substitute x=2 in the equation y=3x−7, we get
y=3×2−7
⇒y=6−7=−1
Now, substitute x=3 in the equation y=3x−7, we get
y=3×3−7
⇒y=9−7=2
So now we have points that are enough to draw a graph.
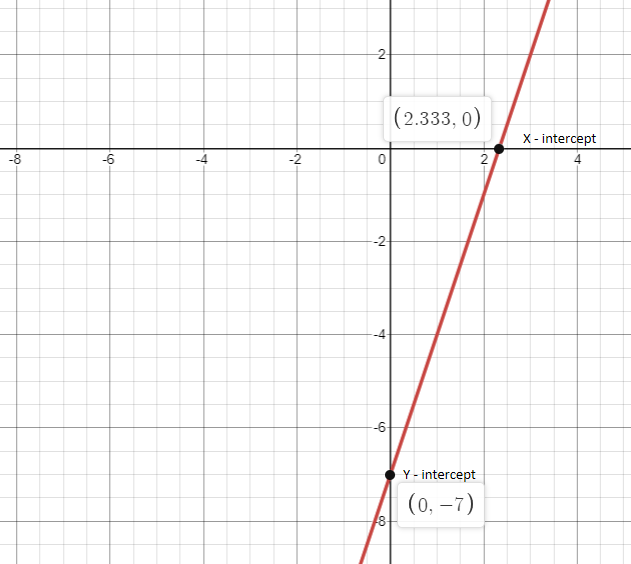
Plot the graph for the points, (0,−7) , (37,0) , (1,−4) , (2,−1) and (3,2) .
The graph for the above points is as shown below:
Note:
Whenever they ask us to draw a graph by giving an equation, then just assume values for one unknown that is x and find the corresponding values of another unknown that is y. Plot the same on a graph sheet. We require a minimum of two points to draw a graph but for your understanding try to take some more points and draw the graph as per the points.