Question
Question: How do you graph \[y = - 3x + 5\] using slope intercept form?...
How do you graph y=−3x+5 using slope intercept form?
Solution
In this question, we draw a graph using the above equation. The equation which is given above is a straight line equation. In the above equation is an independent variable and y is a dependent variable. For drawing the graph, first we calculate the points and points are calculated as we put the value of x like (0,1,2,.......) in the above equation and then find the value of y. then we draw the graph by using these points.
Complete step by step answer:
Now we come to question, in the question the straight-line equation is given as below.
⇒y=−3x+5
The slope is m=−3.
Now we find the points from the above equation.
We put the value of x=0 in the above equation, and then we find the value of y.
The value of y is =5
Then the point is (0,5).
Now, we put the value of x=1in the above equation, and then find the value of y.
The value of y is =2
Then the point is (1,2).
Then, we put x=2 in the above equation then y=−1. Then the point is (2,−1).
Hence, we calculate the same for other points.
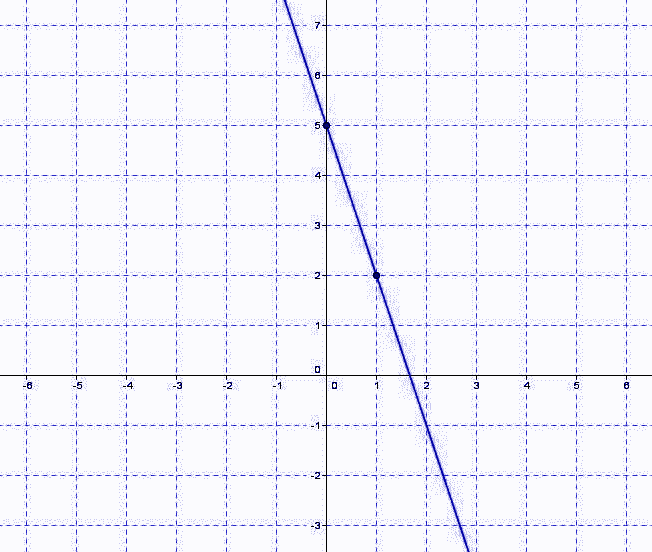
Now we draw the graph by using the points.
The points are ((0,5),(1,2),(2,−1)).
Therefore, the graph is drawn as below.
Note:
In this question, we use the word slope intercept form. Slope intercept form is defined as the form of straight-line equation. Slope intercept form is represented as below.
⇒y=mx+c
Where,
m= Slope
c= It is y intercept
And x and y are the variable. Where x is an independent variable and y is a dependent variable. When we put the value of x then we find the value of y.
draw the graph.