Question
Question: How do you graph \(y = 3 - x\)...
How do you graph y=3−x
Solution
The given equation may be rearranged and written in the slope-intercept form. We can substitute different values of x and acquire the values of y. The points thus obtained can be graphed on a graph paper. These points should be connected to get the desired graph.
Complete Step by Step Solution:
The general equation of a straight line is y=mx+c. The equation given in the question is y=3−x.
Rearranging the terms of the equation, y=−x+3
The equation can be expressed in the general form as y=(−1)x+3 . From this we can deduce that the value of the slope is -1 and the value of the y intercept is 3, i.e., m=−1 and c=3
In order to draw the graph of the given line, we need to plot the points that lie on the line. To find such points, we consider a few values of x and find the corresponding values of y.
When, x=0 , then, y=−0+3=3. The point is (0,3)
When, y=0 , then, x=3 . The point is (3,0)
When, x=1 , then, y=−1+3=2. The point is (1,2)
When, x=2 , then, y=−2+3=1. The point is (2,1)
Finding 2 points is mandatory to graph the equation, however, more points would account to greater precision.
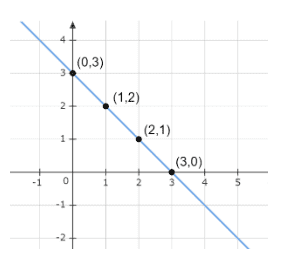
This is the required graph.
Note:
A linear equation is a two-variable equation whose graph is a line. The graph of a linear equation is a set of points in the coordinate plane that are all solutions of the equation. If all the variables represent real numbers, the equation can be plotted by plotting enough points to recognize a particular pattern and then connecting the points to include all the points.