Question
Question: How do you graph \( y - ( - 3) = - \dfrac{1}{2}(x - (0)) \) ?...
How do you graph y−(−3)=−21(x−(0)) ?
Solution
Hint : In this question, we are given an equation in terms of two unknown variable quantities “x” and “y” and we have to find its graph. To graph any equation, we have to first convert it into standard form. As x and y have a degree 1, so the given equation is an equation of a straight line. There are various ways to find the graph of a straight line. We can find the graph of a straight line by using any two points lying on the line or by using the slope and one point lying on the line.
Complete step-by-step answer :
We have to graph y−(−3)=−21(x−(0))
We know that the point-slope form of a straight line is –
y−y1=m(x−x2)
The given equation is already in the point-slope form, so on comparing these two equations we get –
m=−21,x1=0andy1=−3
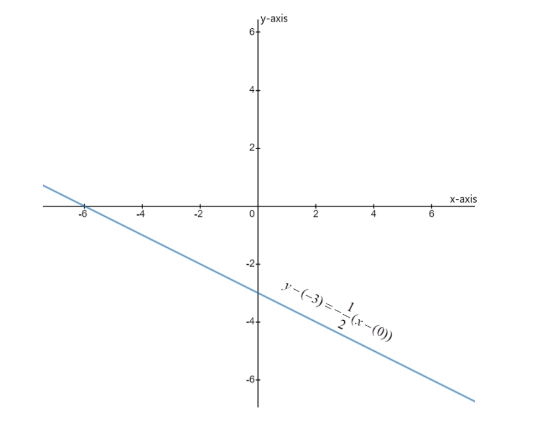
Thus the given line has a slope of −21 and has y-intercept at (0,−3) .
Using these two, we can plot the graph of y−(−3)=−21(x−(0)) as –
Note : The slope of this line is negative; it means that as we increase the value of x, the value of y decreases. If we hadn’t known the slope of the given line, then we would find the coordinates of two points lying on the line by putting random values of one variable and getting the values of the other variable from the given equation. Joining these two points and then extending the obtained line in opposite directions, we will get the graph of the line. This way we can find the graph of any linear equation in terms of two variables.