Question
Question: How do you graph \(y = 3.5x\)...
How do you graph y=3.5x
Solution
Given a linear equation and we have to plot a graph of the linear equation. To plot the graph of the equation, first, we will find the value of the variable y for different values of the variable x. Then the set of these values can be plotted on the set of axes. Then we will join the points to obtain the graph of the linear equation.
Complete step-by-step answer:
We are given the linear equation y=3.5x. Substitute x=−2 into the linear equation to determine the value of y.
y=3.5(−2)
On simplifying the equation, we get:
⇒y=−7
Now we will substitute x=−1 into the linear equation to determine the value of y.
y=3.5(−1)
On simplifying the equation, we get:
⇒y=−3.5
Now we will substitute x=0 into the linear equation to determine the value of y.
y=3.5(0)
On simplifying the equation, we get:
⇒y=0
Then we will substitute x=1 into the linear equation to determine the value of y.
y=3.5(1)
On simplifying the equation, we get:
⇒y=3.5
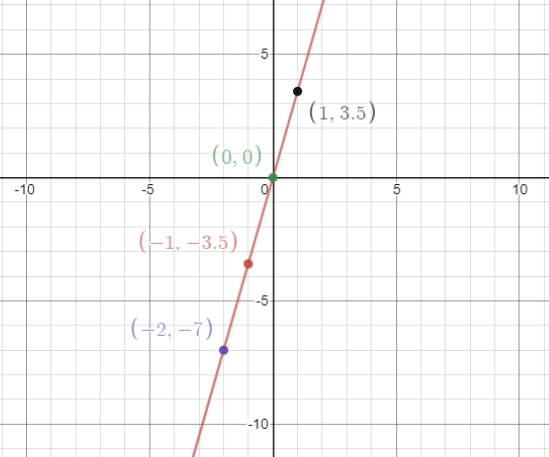
Now we will plot the points on the set of x-axis and y-axis. Then join these points to obtain the graph of the linear equation.
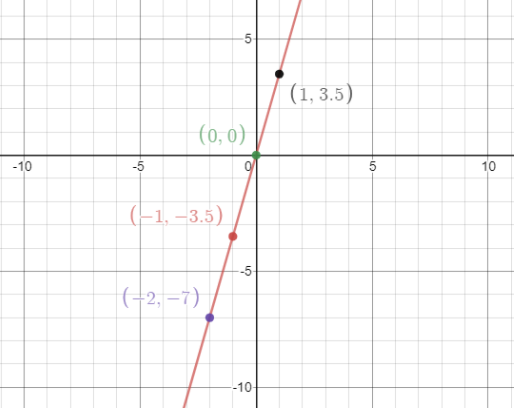
Final answer: Hence the graph of the linear equation is
Note:
In such types of questions students mainly make mistakes while plotting the points on the set of axes. In an ordered pair (x,y), the value of x is the distance of the point from y-axis whereas the value of y is plotted by taking the distance from the x-axis. In such types of questions, the graph of the linear equation is obtained by plotting these points and must be in a straight line.