Question
Question: How do you graph \(y = - 2\cos x + 1\)?...
How do you graph y=−2cosx+1?
Solution
A graph of a function f is the set of ordered pairs; the equation of graph is generally represented as y=f(x) , where x and f(x) are real numbers. We substitute the value of x and we determine the value of y and then we mark the points in the graph and we join the points. The graph for the function y=−2cosx+1 can be plotted by using the graphical transformations.
Complete step by step answer:
In the given question, we have to plot the graph for the given function. A graph of a function is a set of ordered pairs and it is represented as y=f(x), where x and f(x) are real numbers. These pairs are in the Cartesian form and the graph is the two-dimensional graph.
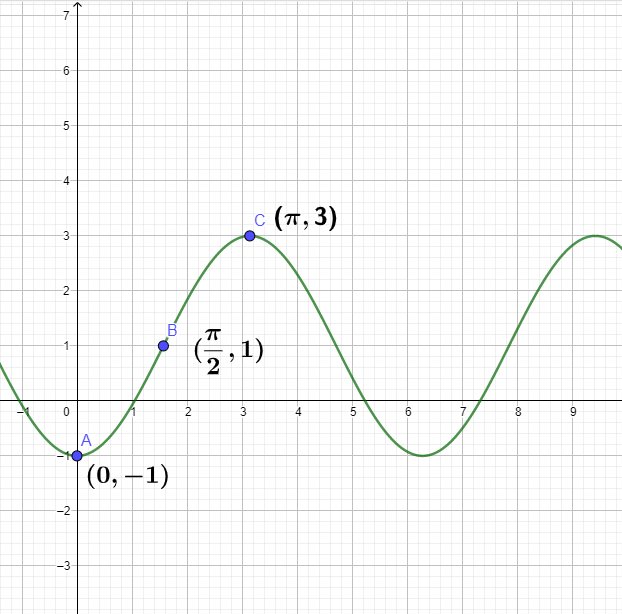
First, we have to find the value of y by using the graph equation y=−2cosx+1.
Let us substitute the value of x as 0.
⇒y=−2cos0+1
We know that the value of cosine for zero angle is 1.
⇒y=−2(1)+1
⇒y=−1
Now we consider the value of x as (2π), the value of y is
⇒y=−2cos(2π)+1
We know that the value of cosine for angle (2π) is zero.
⇒y=−2(0)+1
⇒y=1
Now we consider the value of x as π, the value of y is
⇒y=−2cos(π)+1
We know that the value of cosine for angle π is (−1).
⇒y=−2(−1)+1
⇒y=2+1
⇒y=3
Now we draw a table for these values we have
| x | 0 | (2π) | π |
|---|---|---|---|
| y | −1 | 1 | 3 |
We also know the nature of the graph of cosine function. Hence, we can now plot the graph of the given function y=−2cosx+1 using graphical transformations. So, we will first make the amplitude of the cosine double as the function y=−2cosx+1 has two multiplied by the cosine function. Secondly, we reflect the graph in x axis as there is a negative sign in front of the cosine function. Lastly, we shift the graph one unit upwards as one is added to the cosine function.
The graph plotted for these points is represented below:
Note:
The graph is plotted x-axis versus y axis. The graph is two dimensional. By the equation of a graph, we can plot the graph by assuming the value of x. Graphical transformation can be used to draw graphs for complex functions by manipulating the graphs of simpler functions. If we add a constant to a function, we have to shift the function upwards or downwards depending upon the sign of constant.