Question
Question: How do you graph \( y = 2\cos \left( {2x} \right) \) ?...
How do you graph y=2cos(2x) ?
Solution
Hint : A graph of a function f is the set of ordered pairs; the equation of the graph is generally represented as y=f(x) , where x and f(x) are real numbers. We substitute the value of x and we determine the value of y and then we mark the points in the graph and we join the points.
Complete step by step solution:
Here, in the given question, we have to plot the graph for the given function. A graph of a function is a set of ordered pairs and it is represented as y=f(x) , where x and f(x) are real numbers. These pairs are in the cartesian form and the graph is the two-dimensional graph.
First, we have to find the value of y by using the graph equation y=2cos(2x) .
Let us substitute the value of x as 2π .
⇒y=2cos(2×2π)
⇒y=2cos(π)
We know that the value of cos(π) is (−1) . So, we get,
⇒y=2(−1)
⇒y=−2
Now we consider the value of x as π , the value of y is
⇒y=2cos(2×π)
⇒y=2cos(2π)
⇒y=2×1
⇒y=2
Now we consider the value of x as (4π) , the value of y is
⇒y=2cos(2×4π)
⇒y=2cos(2π)
Now, we know that the value of cos(2π) is zero. So, we get the value of expression as
⇒y=2×0
⇒y=0
Now, we draw a table for these values we have,
| X | 2π | π | (4π) |
|---|---|---|---|
| y | −2 | 2 | 0 |
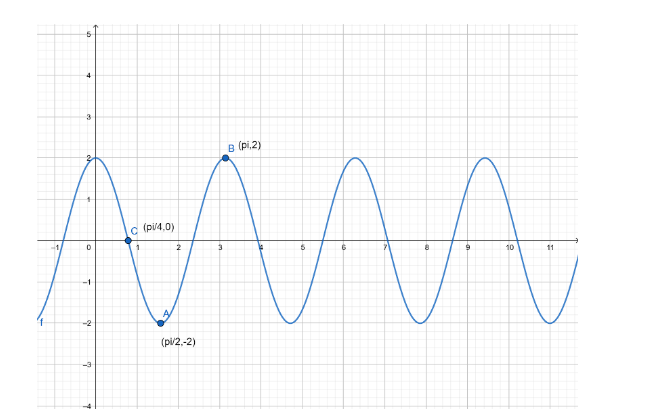
We also know the nature of the graph of cosine function. Hence, we can now plot the graph of the given function y=2cos(2x) with the help of coordinates of the point lying on it. The graph plotted for these points is represented below:
Note : The cosine function can be represented by the general equation y=acos(kx+ϕ) . There are various parameters in this equation such as the amplitude, period and phase shift of the sine function. The value ‘a’ is the amplitude of the cosine function y=acos(kx+ϕ) . The period of the cosine function can be calculated as (k2π) as the value of the function repeats after regular interval of (k2π) radians. Also, if there is a constant added in the function like y=acos(kx+ϕ) , then the graph of the function moves p units vertically upwards due to the upward shift.