Question
Question: How do you graph \(y = 2\cos 3x\)?...
How do you graph y=2cos3x?
Solution
We will write the given equation in the general format of the equation, and find the various parameters such as baseline, amplitude, and shift to plot the graph of the given equation.
Formula used:
y=acos(bx+c)+d
Where a is the amplitude of the equation which tells us the maximum and the minimum value the graph would go from the baseline value,
b is the period of the graph,
c depicts the shift of the equation, positive shift represents that the graph is shifted towards the left and negative shift represents the graph shifting to right.
And d is the baseline of the equation which tells us whether the graph is going upwards or downwards.
Complete step-by-step answer:
We have the given equation as:
y=2cos3x, which is a cosine function which has amplitude 2 and the period of the graph as 3.
Since the value of d is zero, we have the baseline in the graph as 0.
Now the period of the function is found out as: b2π
Therefore, on substituting the value of b as 3, we get:
period=32π
On using the scientific calculator to calculate the period, we get:
period≈2.09
Therefore, the graph of the following function can be plotted as:
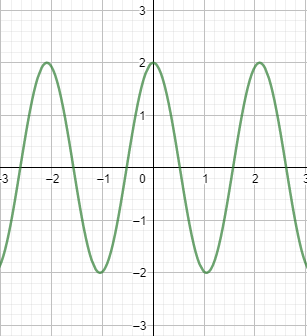
Which is the required solution for the cosine function y=2cos3x
Note:
In this question we are using the cosine function. There also exists the sine function which is represented as: y=asin(bx+c)+d, which has the same properties that of a cosine function.
The sign of the shift c represents in which direction the shift is taking place, it could be negative or positive for right and left respectively.