Question
Question: How do you graph \[y = 2 - 2x\]?...
How do you graph y=2−2x?
Solution
Here, we will substitute different values of x in the given equation to find corresponding values of y. This will help us find different coordinate points. We will use these points to draw the graph of the given equation.
Complete step by step solution:
The given equation is y=2−2x.
We observe from this equation that the powers of both x and y are 1.
So, the given equation is a linear equation. The graph of a linear equation is always a straight line.
Let us find two points lying on the graph of the given linear equation. The two points to be found are those that satisfy the linear equation.
Let us rewrite the given equation as 2x+y=2.
Let us substitute x=0 in the given equation and find the value of y.
2(0)+y=2
Simplifying the equation, we get
⇒y=2
We see that when x=0, we get y=2. So, one point is A(0,2).
To find another point, we will put y=0 in the given equation. Therefore, we get
2x+(0)=2 ⇒2x=2
Dividing both sides by 2, we get
⇒x=1
In this case, we get x=1. So, the second point is B(1,0).
Using these points, we will draw the graph of 2x+y=2.
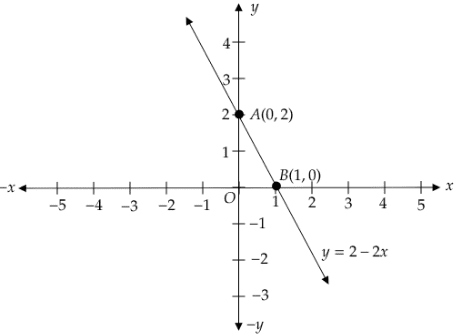
The point A(0,2) will lie on the y-axis, since the x -coordinate is zero. The point B(1,0) will lie on the x -axis since the y- coordinate is zero.
Therefore, we get the graph as follows:
Note:
Another method to draw the graph is by slope-intercept form. We will compare the given linear equation to the slope-intercept form of a linear equation which is y=mx+c, where m is the slope of the line and c is the y− intercept, i.e., the point where the graph cuts the y−axis.
Comparing the equation y=2−2x with y=mx+c, we get m=−2 and c=2. Here the slope is −2 and the y− intercept is 2. First, we have to mark the y− intercept. Since, the y− intercept is positive, i.e., 2, it will lie on the +y axis. So we got the point as A(0,2).
Now, the slope is −2 , which can be written as −2=1−2. Here the numerator −2 means we have to go 2 units down the point 2 and the denominator 1 means we have to go right by 1 unit. So, the point we reach is B(1,0). We get the same graph as above.