Question
Question: How do you graph \(y=1-\cos x\) ?...
How do you graph y=1−cosx ?
Solution
In this question, we have to plot the graph of an equation. The equation given to us consists of trigonometric functions. So, we will first draw the graph of the parent function cosx, which is y=cosx and then we will draw the graph of y=−cosx as given in the question. After that, we see that both the parent function graph and y=−cosx , will have the same range. Then we will add 1 on the right-hand side of the equation and make the necessary changes in the new graph, that is we see that the new graph will shift upwards and lie above the x-axis, which is the required solution to the problem.
Complete answer:
According to the question, we have to plot a graph of a trigonometric equation.
The equation given to us is y=1−cosx
So, first, we will draw the graph of the parent function, that is
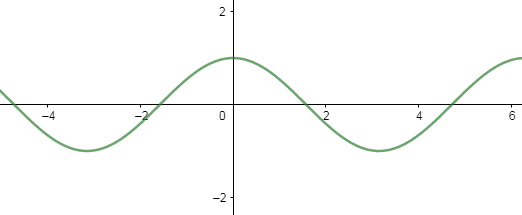
⇒y=cosx ----------- (1)
As we know the domain of cosx function is real numbers, and its range is −1≤cosx≤1 , therefore the graph of the equation (1) is
Now, we will draw the graph of y=−cosx , because it is given in the question, we get
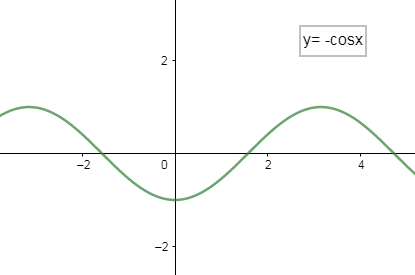
Thus, we see the graph of y=−cosx , reflect over the x-axis
Now, we will add 1 on the right-hand side of the equation (1), which means we are shifting our graph up by 1 unit, therefore, we get
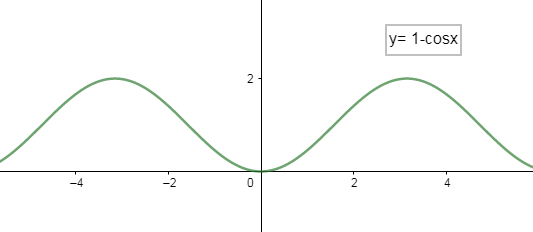
Therefore, we see in the above graph that as we add 1, the actual graph of y=−cosx shifts upward and lies above the x-axis.
The range of the new equation, that is y=1−cosx , is [0, 2].
Note: While drawing the graph in this question, do mention all the equations you are plotting. Keep in mind that 1 is adding in the equation y=−cosx and that is why the graph shifts upward and not below the x-axis.