Question
Question: How do you graph \(y=0x+3\) ?...
How do you graph y=0x+3 ?
Solution
The above question requires us to plot the graph of the linear equation y=0x+3 . We can do this by multiple methods, which include finding the points and then drawing the graph of the given line or we can write the equation in the slope-intercept form and find the points that lie on the same line.
Complete step by step solution:
Given the equation of the line is: y=0x+3
Let us compare the given equation to the general form of a line in the slope-intercept form, which is given by y=mx+c, where m is the slope of the line and c is the intercept of the line on the y - axis.
After comparing the two equations we get the slope of the line as m=0 and the intercept as c=3
Now, let us find some points to plot the graph of the given line by substituting the values of x and y
The equation is y=0x+3
Let us take x=0 then we get the value of y=3
Similarly, if we take x=1 then we get the value of y=3
For the value of x=2 also, we get the value of y=3
From the above values, we can conclude that for every value of x we get the value of y as y=3
Now, taking the points we have calculated, plot the graph for the given equation.
The graph of the equation is given below, where the blue line represents the line.
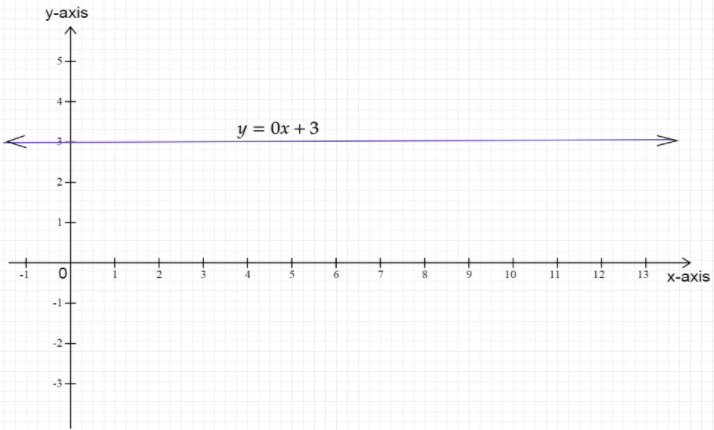
Note: From the graph, we can see that the given equation of a line represents a line that is parallel to the x- axis. Therefore, if ever equations like y=c or x=c are given, where c means a constant, then on plotting the equation we will always get a parallel line to x- axis or y- axis respectively.