Question
Question: How do you graph \[x + y = 4\]?...
How do you graph x+y=4?
Solution
Here, we will substitute the different values of x in the given equation to get the corresponding values of y. From this we will get the coordinate points and using these points we will draw the required graph.
Complete step-by-step answer:
The given equation is a linear equation in two variables as it is having two variables x and y.
Now, as we know that a linear equation in two variables can have infinitely many solutions.
Thus, we will write the given equation x+y=4 such that x becomes an independent and y becomes a dependent variable. This means that x can take any value whereas the value taken by y will depend on it.
Thus, the given equation can be written as:
y=4−x
Here, substituting x=0, we get,
y=4−0=4
Then, substituting x=2, we get,
y=4−2=2
And, substituting x=4, we get,
y=4−4=0
Therefore, we can make the following table:
| X | 0 | 2 | 4 |
|---|---|---|---|
| Y | 4 | 2 | 0 |
Hence, we will plot the points (0,4),(2,2),(4,0) on the graph to show the given equation.
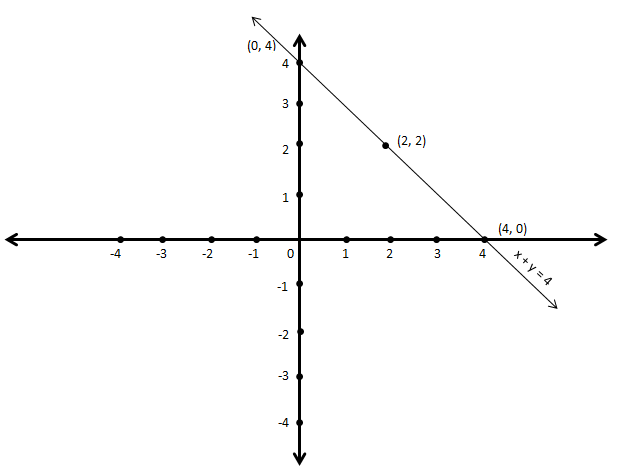
Therefore, this is the required answer.
Note:
An equation is called linear equation in two variables if it can be written in the form of ax+by+c=0 where a,b,c are real numbers and a=0 , b=0 as they are coefficients of x and y respectively. Also, the power of linear equations in two variables will be 1 as it is a ‘linear equation’. Also, a linear equation in two variables can sometimes have infinitely many solutions rather than only one in the case of ‘one variable’. The graph of a linear equation is always a straight line.