Question
Question: How do you graph \(x-y=0\)?...
How do you graph x−y=0?
Solution
Change of form of the given equation will give the x-intercept and y-intercept of the line x−y=0. We change it to the form of px+qy=1 to find the x intercept, and y intercept of the line as p and q respectively.
Then we place the points on the axes and from there we draw the line on the graph.
Complete step by step solution:
We are taking the general equation of line to understand the slope and the intercept form of the line
x−y=0.
We change from the equation x−y=0 to y=x.
The given equation is in the form of y=mx+k. m is the slope of the line. The slope of the line is 1.
We have to find the x-intercept, and y-intercept of the line x−y=0.
For this we convert the given equation into the form of px+qy=1. From the form we get that the x intercept, and y intercept of the line will bep and q respectively. The points will be (p,0),(0,q).
The given equation is x−y=0. Converting into the form of px+qy=1,
we get
x−y=0⇒0x+0y=1
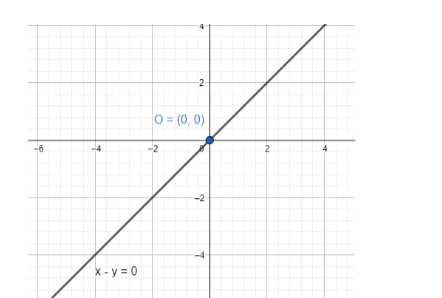
We don’t find any intercepts as the form is not possible to create. This means the line intersects the axes at the same point. We can see that the line goes through the origin of (0,0). The line x−y=0 cuts the axes at (0,0).
Note: A line parallel to the X-axis does not intersect the X-axis at any finite distance. Hence, we cannot get any finite x-intercept of such a line. Same goes for lines parallel to the Y-axis. In case of slope of a line the range of the slope is 0 to ∞.