Question
Question: How do you graph \(x=-3\) ?...
How do you graph x=−3 ?
Solution
x=−3 is a straight line where x is constant irrespective of y. The graph will be a straight line parallel to Y axis at a distance of 3 units from Y axis towards left. The slope of the straight line is infinity as it is parallel to the Y axis.
Complete step by step answer:
In x=c the value of x is a constant that means it does not depend on the value of Y. So it will be a straight line parallel to Y axis at a distance ∣c∣ units from the Y axis towards left or right depending whether c is positive or negative.
So the graph of x=−3 will be a straight line parallel to the Y axis at a distance of 3 units towards the left of the Y axis.
So let’s draw the graph of x=−3
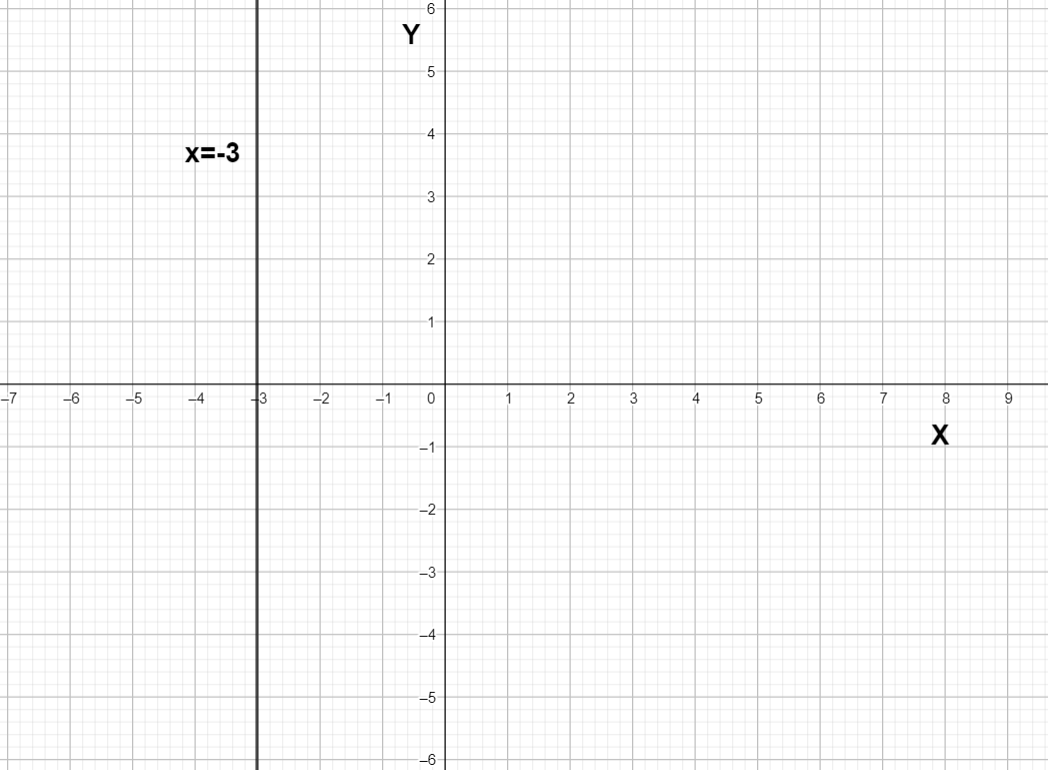
We can see that the graph is a straight line where the line is parallel to the Y axis .
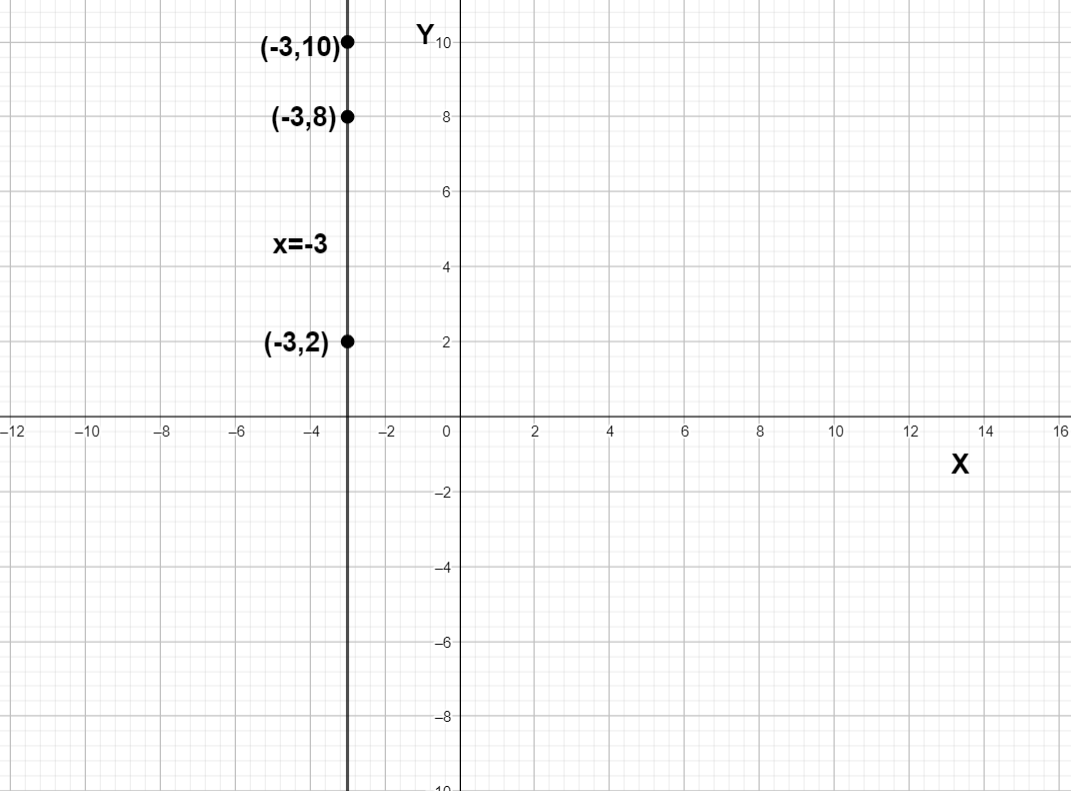
We can try another method. We can take several points of the function and join them to draw the graph. So let’s take points (-3,2) , (-3,8) , (-3,10) and join them to draw the graph.
Note: We know that the standard form of a straight line is y=mx+c but when x is constant the value of m is tend to infinity so we can’t write the straight line in the form of y=mx+c there is no c here because the straight line does not intersect Y axis so there is no Y intercept unless the equation is x=0 in that case there are infinite value of c.