Question
Question: How do you graph \[x-2y=1\] using the intercepts?...
How do you graph x−2y=1 using the intercepts?
Solution
We can draw the graph using intercepts concept. First we have to find the x and y intercepts. we have to make x as 0 while calculating y intercept and we have to make y as 0 while calculating x intercept. By solving this we can get the x and y intercepts to draw the graph.
Complete step by step answer:
Given equation is
x−2y=1
Now we have to find the x intercept of the equation.
To find it we have to substitute the y value with 0.
By substituting it and simplifying it we will get the x intercept .
Now we are going to substitute y=0 in the equation.
We will get
⇒x−2(0)=1
⇒x−0=1
From this we can write
⇒x=1
So the x intercept of the equation is 1
The point to plot on the graph is (1,0)
Now we have to find the y intercept of the equation.
To find it we have to substitute the x value with 0.
By substituting it and simplifying it we will get the y intercept .
Now we are going to substitute x=0 in the equation.
We will get
⇒0−2y=1
⇒−2y=1
We have to divide the equation with 2 on both sides
From this we can write
⇒2−2y=21
By simplifying it we will get
⇒−y=0.5
To find the value of y we have to multiply the equation with the− sign.
We will get
⇒y=−0.5
So the y intercept of the equation is −0.5
The point to plot on the graph is (0,−0.5)
So the intercepts of x and y are 1 and −0.5 respectively.
Now we have to plot the graph it will look like
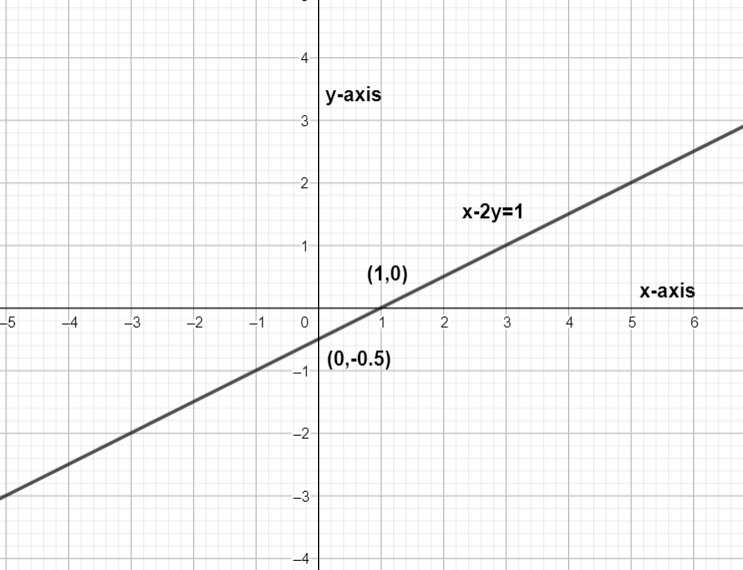
Note: We can also take different values for x and y and plot the graph. But here it is mentioned as an intercept we are taking the values as 0 otherwise we can take the values of our own choice and draw the graph.