Question
Question: How do you graph \[x = 2\] by plotting points?...
How do you graph x=2 by plotting points?
Solution
To solve this question first we have to show that this equation is independent of two variables that are x and y. Then we assume some points and tell them that on joining these points we get a graph of the given equation. and we have to explain how we make graphs in 2-D, not in 3-D.
Complete step-by-step answer:
We have given an equation x=2.
We are told how we draw the graph of the equation x=2.
For making the graph we have to find some points and then join them.
x=2 is the given equation which is free from the variable y and z.
So if we put any point in place of y and z then there is no effect on the x variable.
We have to make a graph in the 2-D plane so we will not put the z variable and mark some points on x and y.
So the points are-
(2,8), (2,-1), (2,0) and (2,6)
The graph of the given equation is.
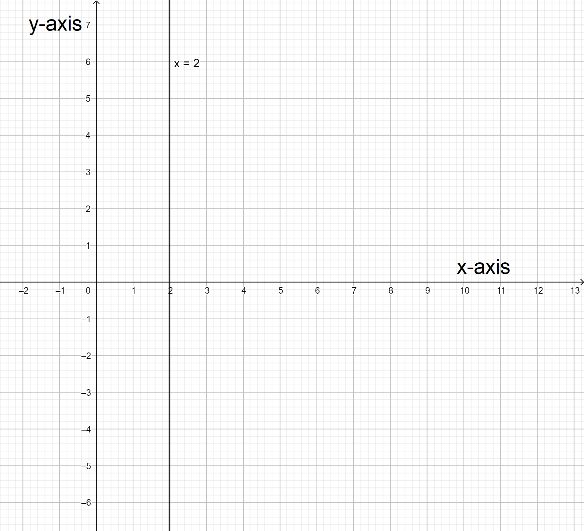
Final answer:
According to the points, the graph of the line x=2 is a vertical line passing through 2 on the x-axis.
Note: Although this is a very easy question we have to know some points. If we show a variable equal to any constant number on a number line then that is a point. If we show that in a plane then that is a line. And if we show that in 3D view then that is a plane. Minimum two numbers are required to make a line.