Question
Question: How do you graph \[x = - 10\] using intercepts?...
How do you graph x=−10 using intercepts?
Solution
Here, we need to graph the given line. We will take the abscissa and ordinate 0 to find the intercepts, and use them to draw the graph of the given equation. The abscissa of a point (x,y) is x, and the ordinate of a point (x,y) is y.
Complete step-by-step solution:
First, we will find the intercepts of the given line.
Rewriting the equation, we get
x+0×y=−10
Substituting 0 for y in the equation, we get
x+0×0=−10
Therefore, we get
x=−10
The x-intercept of the given line is −10.
This means that the line touches the x-axis at the point (−10,0).
Substituting 0 for x in the equation, we get
0+0×y=−10
Therefore, we get
0=−10
This is incorrect.
The given line has no y-intercept.
Therefore, there is no point on the given line that has the abscissa 0.
This means that the line does not touch the y-axis at any point.
When two straight lines do not touch each other at any point, they are called parallel lines.
This means that the graph of the line x=−10 is parallel to the y-axis.
Now, we will draw the graph of the given line.
The graph of the line x=−10 touches the x-axis at the point (−10,0), and is parallel to the y-axis.
The value of x remains −10 for all values of y.
Drawing the graph of the line x=−10, we get
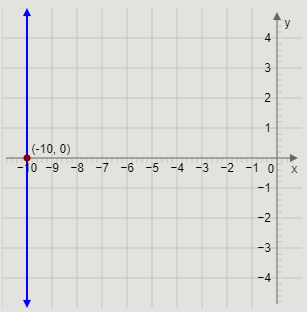
This is the required graph of the line x=−10.
Note:
We can also rewrite the equation using the intercept form of a line.
The intercept form of a line is given by ax+by=1, where a and b are the x-intercept and y-intercept cut by the straight line respectively.
Dividing both sides of the given equation by −10, we get
−10x=1
Here, −10 is the x-intercept, and there is no y-intercept.