Question
Question: How do you graph \(x<-0.5\)?...
How do you graph x<−0.5?
Solution
We try to take points which have x coordinates less than −0.5. There is no restriction on the y coordinates. Based on the points we try to find the space or region in the 2-D plane which satisfies x<\-0.5.
Complete step by step solution:
The inequation x<−0.5 represents the space or region in 2-D plane where the x coordinates of points are valued less than −0.5.
We first take some points for the x coordinates where x<−0.5.
The values will be x=−1,−2,−5,−10.
We can take the y coordinate anything we want. The inequation is only based on the values of the x coordinates.
So, for y coordinate we take y=−2,5,0,−10 respectively for the x coordinates x=−1,−2,−5,−10
The points are (x,y)=(−1,−2);(−2,5);(−5,0);(−10,−10).
We put these points in the graph to get
Based on the points we can measure the region.
Now we try to draw the line x=−0.5=−21.
Then we take all the x coordinates which have less value than x=−21.
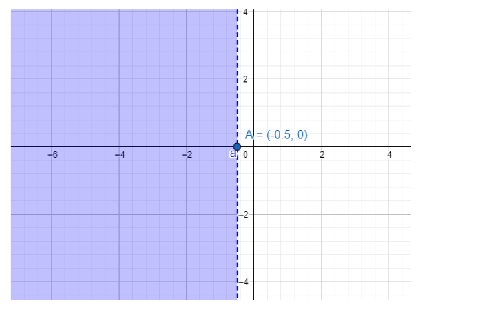
The dotted line is the equation x=−21. All the points on the left side have x coordinates valued less than x=−21.
So, all those points on the marked area are solutions to the inequation x<−0.5.
Note: We can also express the inequality as the interval system where x<−0.5 defines that x in(−∞,−0.5). The interval for the y coordinates will be anything which can be defined as y∈(−∞,∞). We also need to remember that the points on the line x=−0.5 will not be the solution for the inequation.