Question
Question: How do you graph using the slope and intercept of \( -8x+2y=4 \) ?...
How do you graph using the slope and intercept of −8x+2y=4 ?
Solution
Hint : we have given an equation of a line as −8x+2y=4 , which is a straight-line equation. In order to draw a graph of the given equation, we will need to write the equation in a slope intercept form. A straight-line equation is always linear and represented as y=mx+c where m is the slope of the line and c is the y-intercept and m−c is the x-intercept.
Now, getting the points we can easily plot the graph of the given straight line equation.
Complete step-by-step answer :
We have equation of line,
−8x+2y=4
Rewrite the above equation in a slope intercept form, i.e. y=mx+c
y=4x+2
Now we compare this given equation with the general linear equation i.e., y=mx+c
Hence ,
Slope of the given line, m=4 .
y-intercept of the given line , c=2 .
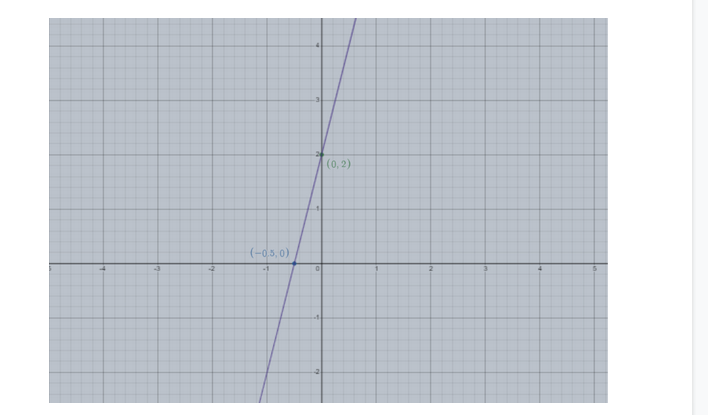
Therefore, we can say that point (0,2) lies on the line.
x-intercept of the given line , m−c=4−2=−21 .
Therefore, we can say that point (2−1,0) lies on the line.
With the help of two points, we can plot the graph by connecting the points as follow,
Note : Slope of a line can also be found if two points on the line are given. Let the two points on the line be (x1,y1),(x2,y2) respectively.
Then slope is given by, m=x2−x1y2−y1 .
Slope is also defined as the ratio of change in y over the change in x between any two points.
y-intercept can also be found by substituting x=0 .
Similarly, x-intercept can also be found by substituting y=0 .