Question
Question: How do you graph using the intercepts for\[6x-y=4\]?...
How do you graph using the intercepts for6x−y=4?
Solution
Hint : In order to graph plot for the equation,6x−y=4, we need the points to be plotted in the graph, however here, we need to draw using the intercepts , for this, we can find the two intercepts , x−and y−intercepts by putting xand yzero one by one and then simply plotting the intercepts.
Complete step-by-step answer :
Firstly let us write the equation, for which we need to plot the graph
6x−y=4
Let us find the x−and y−intercepts
Now, to find thex−intercept, put y=0in the equation
i.e.
Therefore, the x−intercept is 32
Now, let us find they−intercept
For this, let us put x=0in the equation
Thus, we get the y−intercept, which is −4
Therefore, we get the intercept points as
(32,0)and(0,−4)
Now, if we plot these two points in the graph, we get
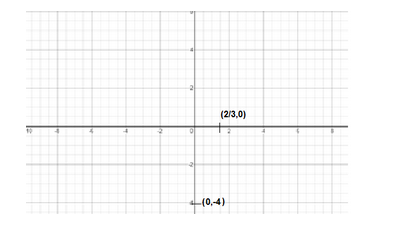
Now, this equation is for a straight line graph for which the intercepts have been drawn
If we join the two points, we get the graph as required
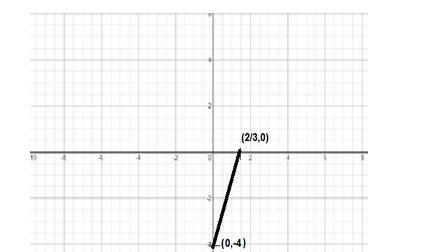
Hence, the graph is plotted.
Note : The formula used for the graph is for finding the intercepts. For finding x−intercept, first put y=0in the equation and in order to find the y−intercept, put x=0, in this way the two points for the graph are found and then plotted to get a straight line graph.
Alternatively, this can also be solved by looking at the equation,
This equation is of the form y=mx+c
Where, mis the slope and cis they− intercept,
And x−intercept is found in the same way as before.