Question
Question: How do you graph using slope and intercept of \(3x + 2y = 21\)?...
How do you graph using slope and intercept of 3x+2y=21?
Solution
In this question we have to plot a graph using slope and intercept of a given straight line. Firstly, we will convert the given equation into a slope intercept form of a straight line. It can be done by first subtracting 3x from both sides of the given equation. Then dividing each term by 2 and rearranging the obtained equation. We then compare the given equation of a line with the standard slope intercept form of a line and find the slope and intercept. We substitute different values of x and obtain the values of y. Then we plot the points (x,y) in the x-y plane and we will have a required graph of the given equation.
Complete step by step answer:
Given the equation of a straight line 3x+2y=21 …… (1)
We are asked to draw the graph using the slope and intercept of the given line.
So firstly we will try to find out the slope of a line given in the equation (1).
To find this, we need to convert our given equation into slope intercept form of a straight line.
The general equation of a straight line in slope intercept form is given by,
y=mx+c …… (2)
where m is the slope or gradient of a line and c is the intercept of a line.
Now we convert the given equation of a line into slop intercept form by rearranging the terms.
Consider the equation of a line given in the equation (1).
Subtracting 3x from both sides of the equation (1), we get,
⇒3x+2y−3x=21−3x
Combining the like terms we get,
⇒3x−3x+2y=21−3x
⇒0+2y=21−3x
⇒2y=21−3x
Now dividing throughout by 2 we get,
⇒22y=221−3x
⇒y=221−23x
Rearranging the above equation we get,
⇒y=−23x+221 …… (3)
Comparing with the standard slope intercept form given in the equation (2), we get,
m=−23 and c=221.
Now to draw a graph of a linear equation, we first assume some values for the variable x and substitute in the above equation and obtain the values of the other variable y.
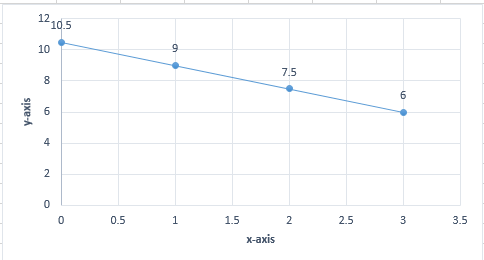
Then plotting these values of x and y on the x-y plane, we get the graph of the given equation.
We first let different values of x.
Substituting x=0 in the equation (3), we have,
y=−23(0)+221
⇒y=221
⇒y=10.5
Substituting x=1 in the equation (3), we have,
y=−23(1)+221
⇒y=2−3+21
⇒y=218
⇒y=9
Substituting x=2 in the equation (3), we have,
y=−23(2)+221
⇒y=2−6+21
⇒y=215
⇒y=7.5
Substituting x=3 in the equation (3), we have,
y=−23(3)+221
⇒y=2−9+21
⇒y=212
⇒y=6
| x | 0 | 1 | 2 | 3 |
|---|---|---|---|---|
| y | 10.5 | 9 | 7.5 | 6 |
Note: Graph of a linear equation is always a straight line. Remember the general form of an equation of a straight line given by y=mx+c, where m is the slope of the line and c is the intercept. If while calculating the points, if someone has made a mistake then all the points obtained after calculations will not come on a straight line. So, we need to calculate carefully while doing calculations for points and also while plotting in x-y plane.