Question
Question: How do you graph \(\theta =\dfrac{\pi }{3}\) ?...
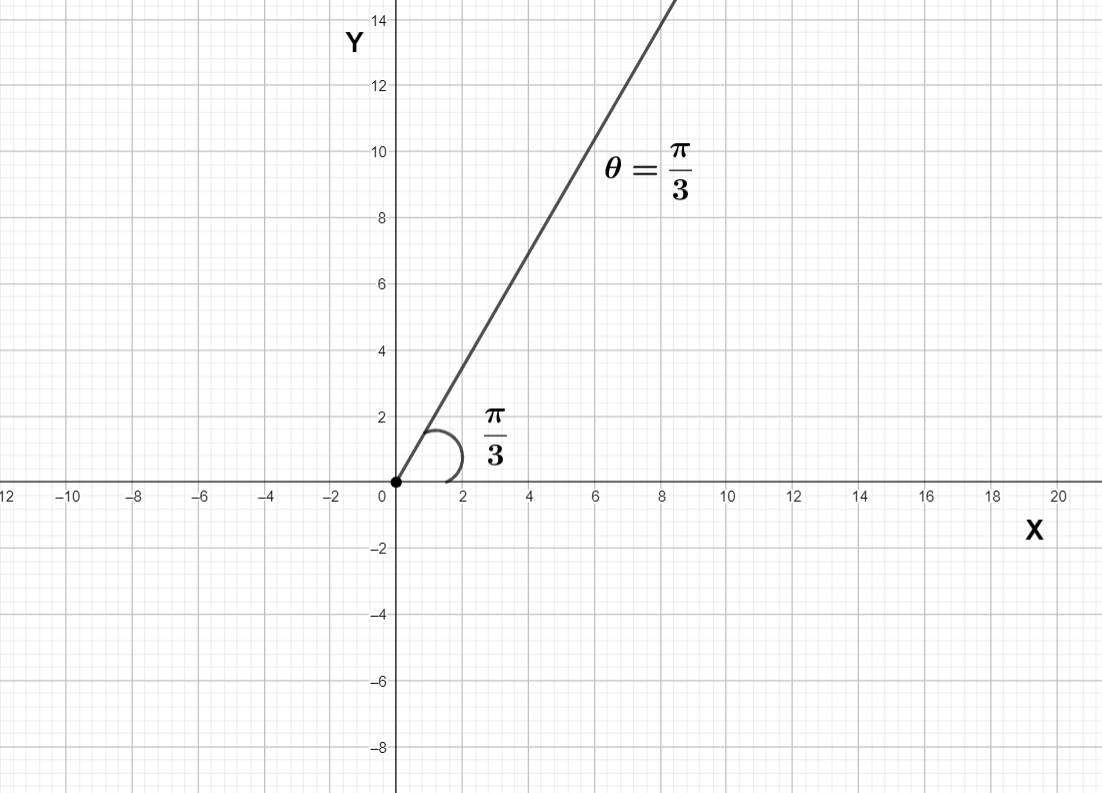
How do you graph θ=3π ?
Solution
The graph of θ=3π is in polar form graph, where θ is the angle between line segment joining point and origin with positive X axis. The graph of θ=3π is the collection of all points which makes an angle of 3π with positive X axis when joined with origin. So we can be sure that all the points are in the first quadrant.
Complete step by step answer:
We have drawn the graph of θ=3π , it is the locus of all points which makes angle of 3π with positive X axis when it is joined with origin , so all such points lie in the first quadrant.
Let’s the point is (x, y) is lie on the graph θ=3π where x, y are positive
So the line joining (x, y) and origin makes an angle 3π with positive X axis
So we can write tan−1xy=3π
So tan3π=xy where x and y are positive
xy=3
⇒y=3x
So the graph of θ=3π is equal to the graph of y=3x in first quadrant
Now let’s draw the graph of y=3x in first quadrant
Note: While converting a polar coordinate form equation into a simple equation, always focus on the quadrant, in which quadrant the graph should be done. In polar form tanθ is equal to xy and the value of r is equal to xy . The given equation that we have drawn a graph for is independent of r where θ is constant. The value of θ can give us the quadrant. If the value of θ is between 0 to 2π it is in first quadrant, next interval of 2π is second quadrant and this goes on to fourth quadrant.