Question
Question: How do you graph the system of linear inequalities \(y\ge 1\) and \(x\le 6\) and \(y< 2x-5\)?...
How do you graph the system of linear inequalities y≥1 and x≤6 and y<2x−5?
Solution
First of all, we need to graph the equalities y=1, x=6, and y=2x−5. Then we have to consider the corresponding inequalities to graph them with the lines of inequalities as the boundaries of their respective regions. The region corresponding to y≥1 will be above the line y=1. The region for x≤6 will be to the left of x=6. And for y<2x−5 we need to substitute the origin and check whether it satisfies it or not. If it satisfies, then the region towards the origin will be shaded, but if it does not satisfy then the opposite region will be shaded. Finally considering the common region to all the three regions will be the final graph.
Complete step by step solution:
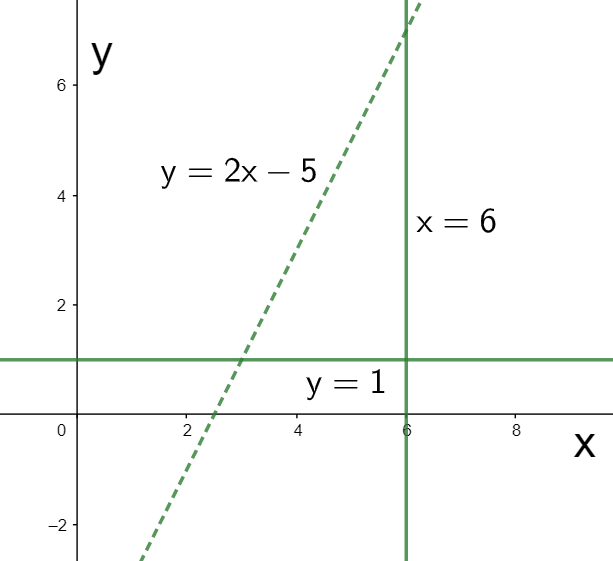
The inequalities given to us in the question are y≥1, x≤6, and y<2x−5. To graph them, we first consider the corresponding equalities y=1, x=6, and y=2x−5. The graph of these is shown in the figure below.
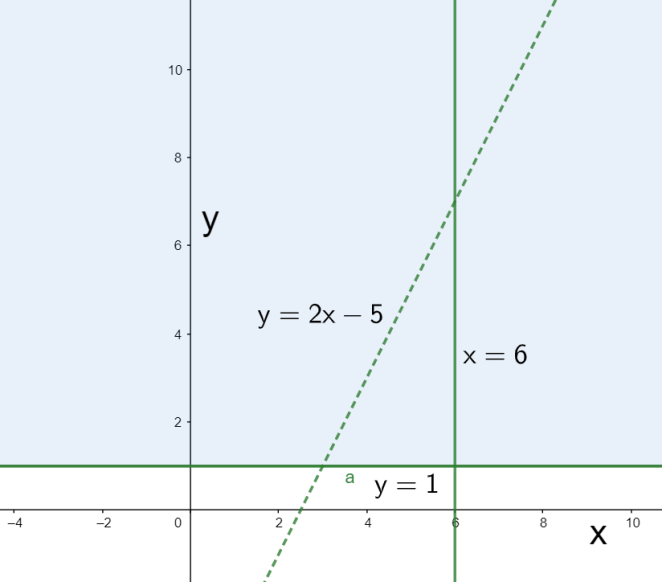
Now, for representing the graph of the inequalities, we need to shade the region for each of the inequalities. Considering the first inequality, we have y≥1. This means the region above the y=1 will be shaded as shown below.
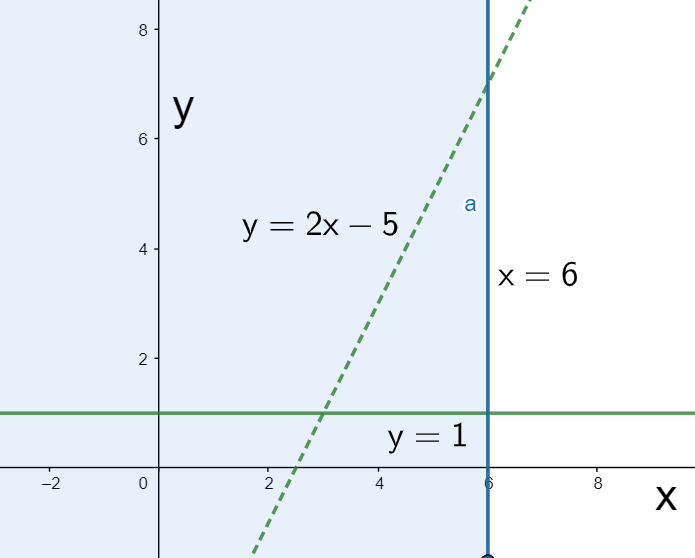
Now, considering the second inequality, we have x≤6. This inequality will be represented by the region to the left of the line x=6 as shown below.
Finally, considering the third inequality, we have y<2x−5. On substituting x=0,y=0 in the inequality, we get