Question
Question: How do you graph the set of ordered pairs {(0,0), (1,3), (-2,4)} ?...
How do you graph the set of ordered pairs {(0,0), (1,3), (-2,4)} ?
Solution
For plotting a point on a graph paper, we must know its coordinates, coordinates are ordered pairs of numbers that are separated by a comma and are always written in brackets; the point on the x- axis is indicated by the first number and the point on the y-axis indicated by the second number. So, x-coordinate is called a number on the x-axis, it is also called abscissa and y-coordinate is called a number on the y-axis and is also called ordinate. We have to first identify the quadrant or axis in which the point lies for plotting the points on the graph.
Complete step by step answer:
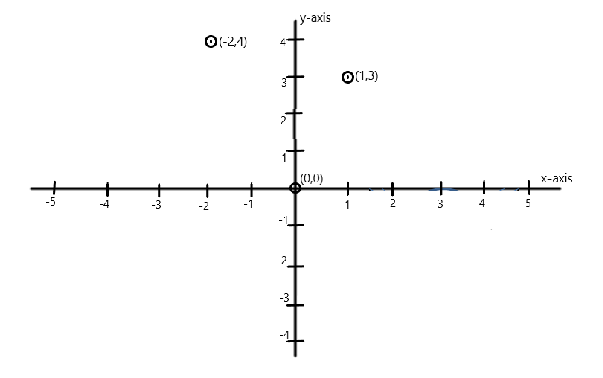
For the point (0,0), the x-coordinate is 0 and the y-coordinate is also 0, thus it is the coordinate of
the origin.For the point (1,3), the x-coordinate is 1 and the y-coordinate is 3, the value of both the x-coordinate and that of y-coordinate is positive so this point lies in the first quadrant.
For the point (-2,4), the x-coordinate is -2 and the y-coordinate is 4, the value of y-coordinate is
positive while that of x-coordinate is negative so this point lies in the second quadrant.
The graph obtained on plotting all these points in the same graph is shown below –
Note: Two axes intersecting at right-angles form a graph and origin is their point of intersection. The x-axis is defined as the axis parallel to the horizontal lines of the paper and y-axis is the axis parallel to the vertical lines of parallel and is perpendicular to the x-axis. A graph is a diagram that is used for showing the relation between two variable quantities, each measured along one of the axes.