Question
Question: How do you graph the parabola \[y = - \dfrac{1}{2}{x^2}\] using vertex, intercepts and additional po...
How do you graph the parabola y=−21x2 using vertex, intercepts and additional points?
Solution
Here in this question, we have to determine the vertex and intercepts for the given equation. By substituting the x is equal to zero we can find the y intercept value and substituting y is equal to zero we can find the x intercept value. By equating the given equation to the general vertex equation we can determine the vertex.
Complete step by step answer:
The given equation is in the form of f(x)=a(x−h)2+k, where (h, k) represents the vertex for the equation. An intercept is a point where the straight line or a curve intersects the y-axis in a plane. If the point x is zero then the obtained point is a y -intercept.
Now consider the given equation y=−21x2 -----------(1)
Substitute the value of x as 0 in equation (1), then we have
⇒y=−21(0)2
On simplifying we get
⇒y=0
Therefore, y-intercept is (0,0)
Substitute the value of y as 0 in the equation (1) then we have
⇒0=−21x2
On simplifying we get
⇒x=0
Therefore, x-intercept is (0, 0)
The general vertex equation of a line is given byf(x)=a(x−h)2+k,----- (2) where (h, k) is a vertex
Since the given equation of a graph is a not having the constant term the vertex will be
(h,k)=(0,0)
Therefore, the vertex is (0,0)
we find the value of y by using the graph equation y=−21x2. Let we substitute the value of x has -2, -1, 0, 1 and 2
Now we consider the value of x as -2, the value of y is
Now we consider the value of x as -1, the value of y is
⇒y=−21(1)2 ⇒y=−0.5Now we consider the value of x as 0, the value of y is
⇒y=−21(0)2 ⇒y=0Now we consider the value of x as 1, the value of y is
⇒y=−21(1)2 ⇒y=−0.5Now we consider the value of x as 1, the value of y is
⇒y=−21(2)2 ⇒y=−2Now we draw a table for these values we have
| X | -2 | -1 | 0 | 1 | 2 |
|---|---|---|---|---|---|
| y | -1 | -0.5 | 0 | -0.5 | -1 |
The graph plotted for this point is represented below:
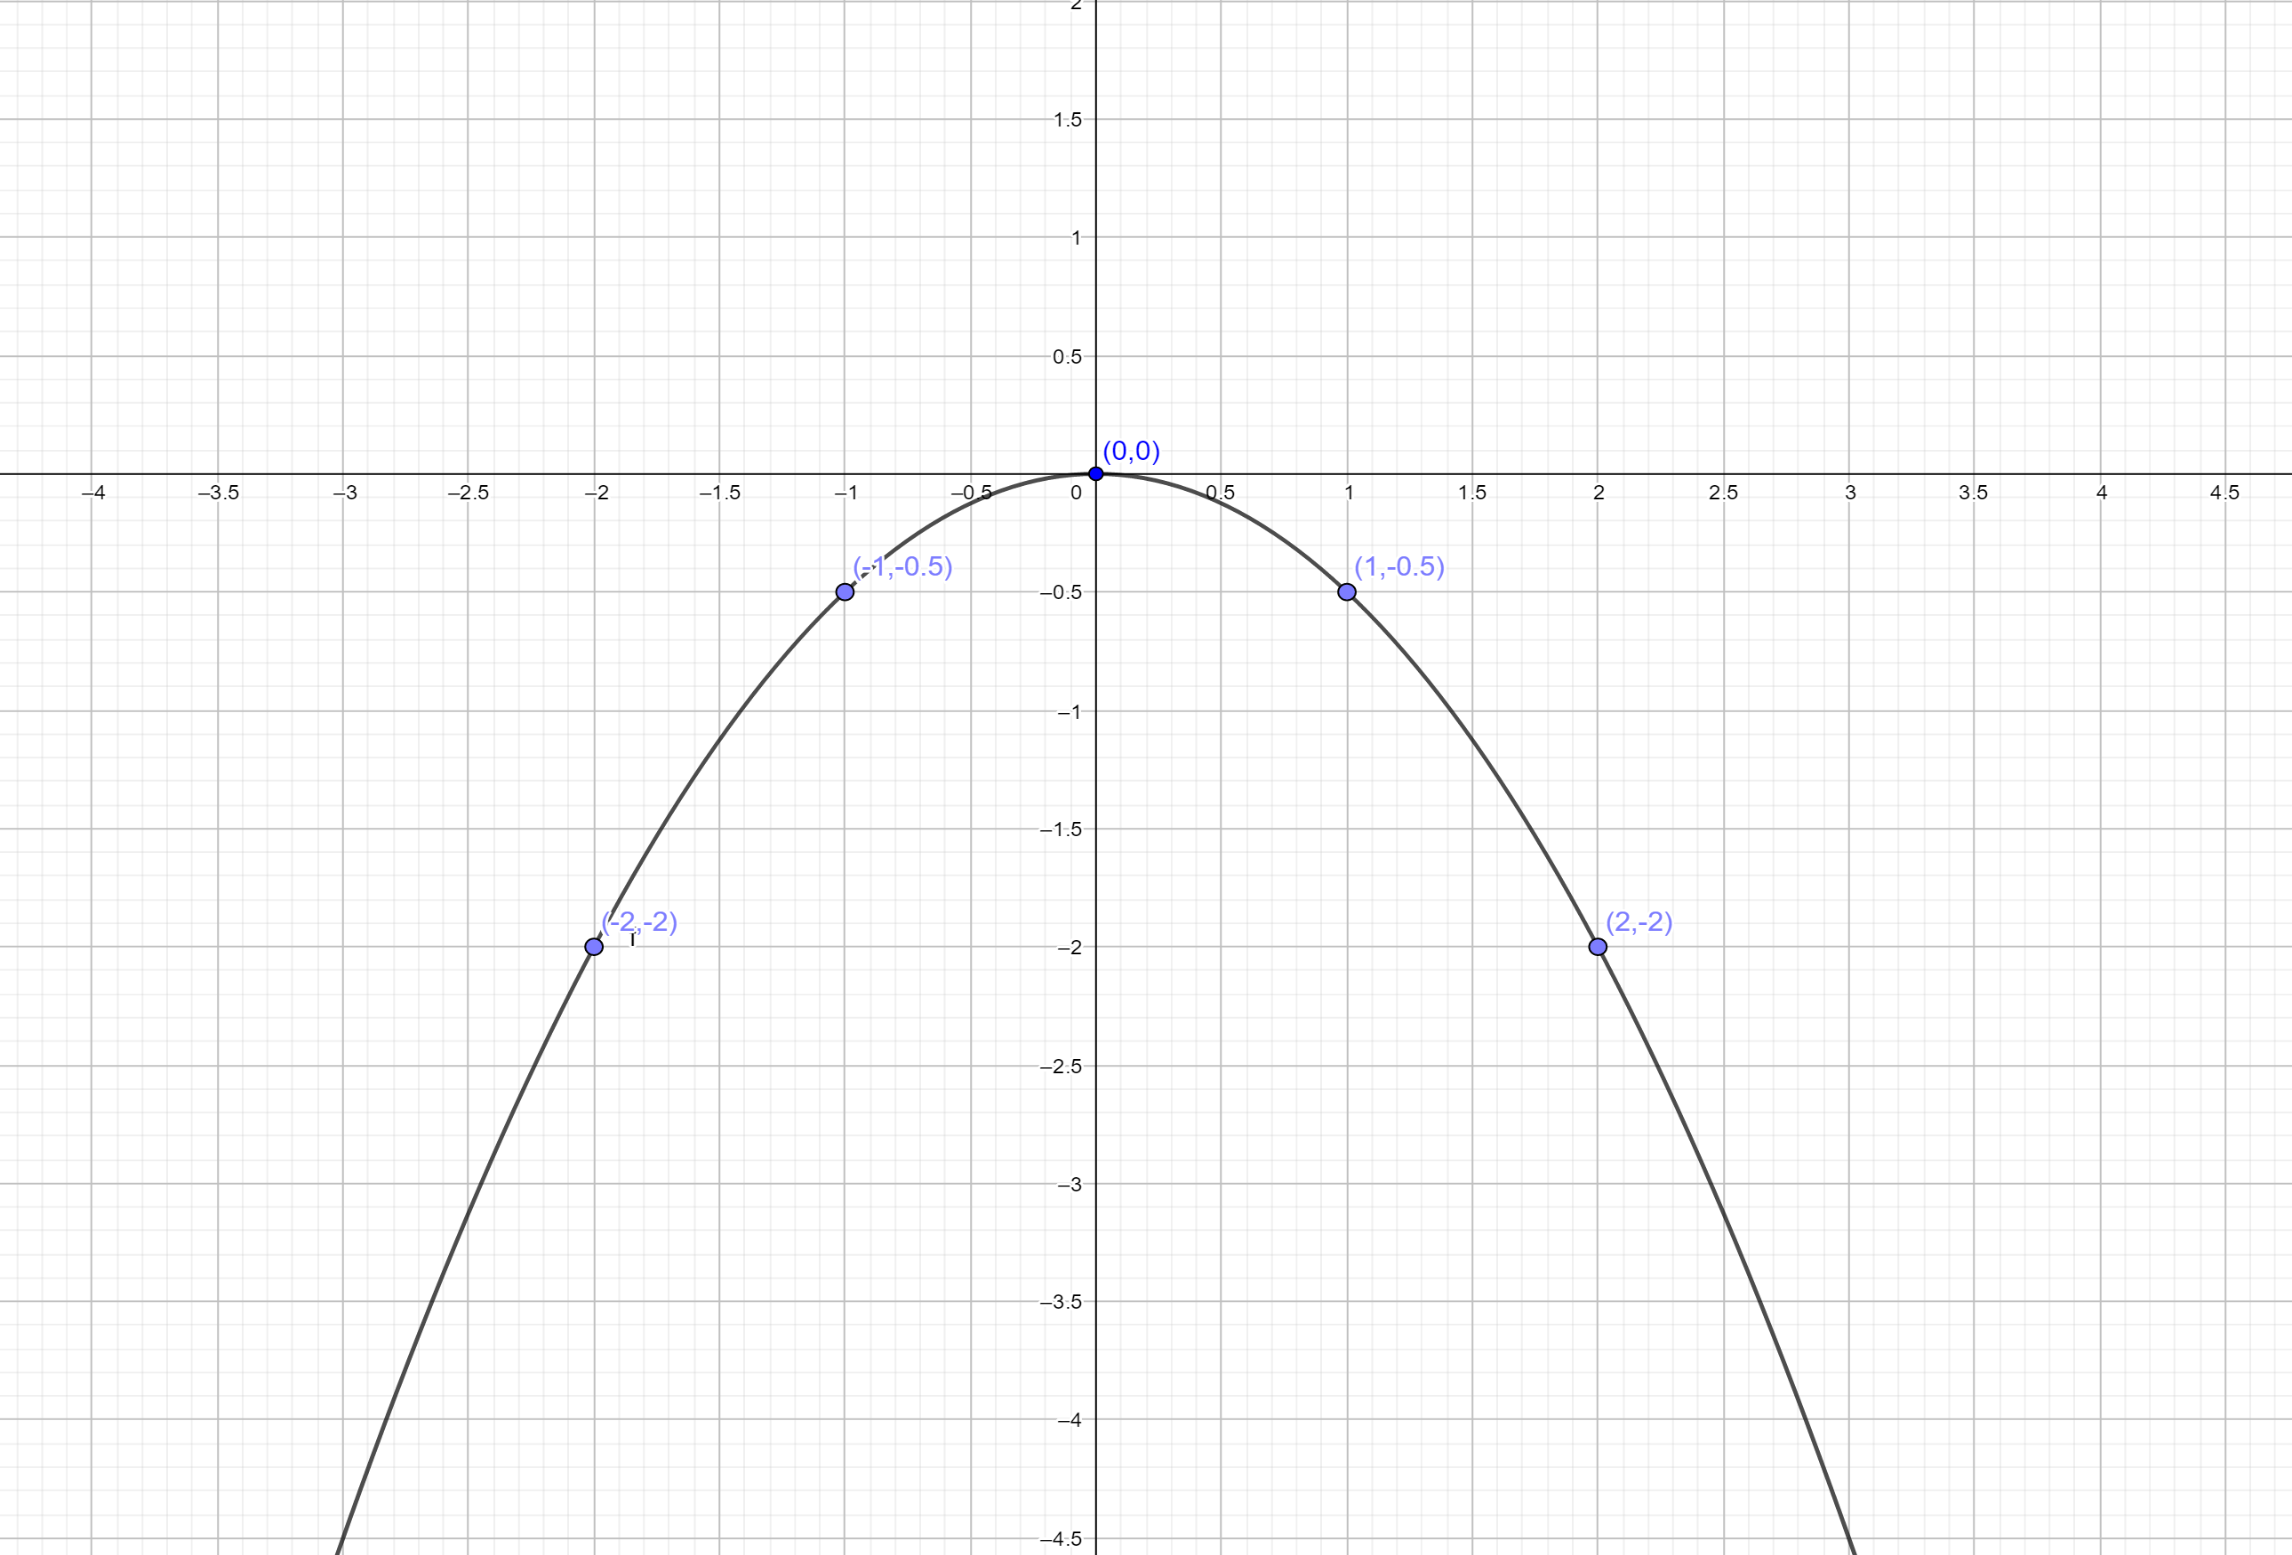
Note: The graph is plotted x-axis versus y axis. The graph is two dimensional. By the equation of a graph, we can plot the graph by assuming the value of x. We can’t assume the value of y. because the value of y depends on the value of x. hence, we have plotted the graph.