Question
Question: How do you graph the linear function \(f\left( x \right) = - x + 4?\)...
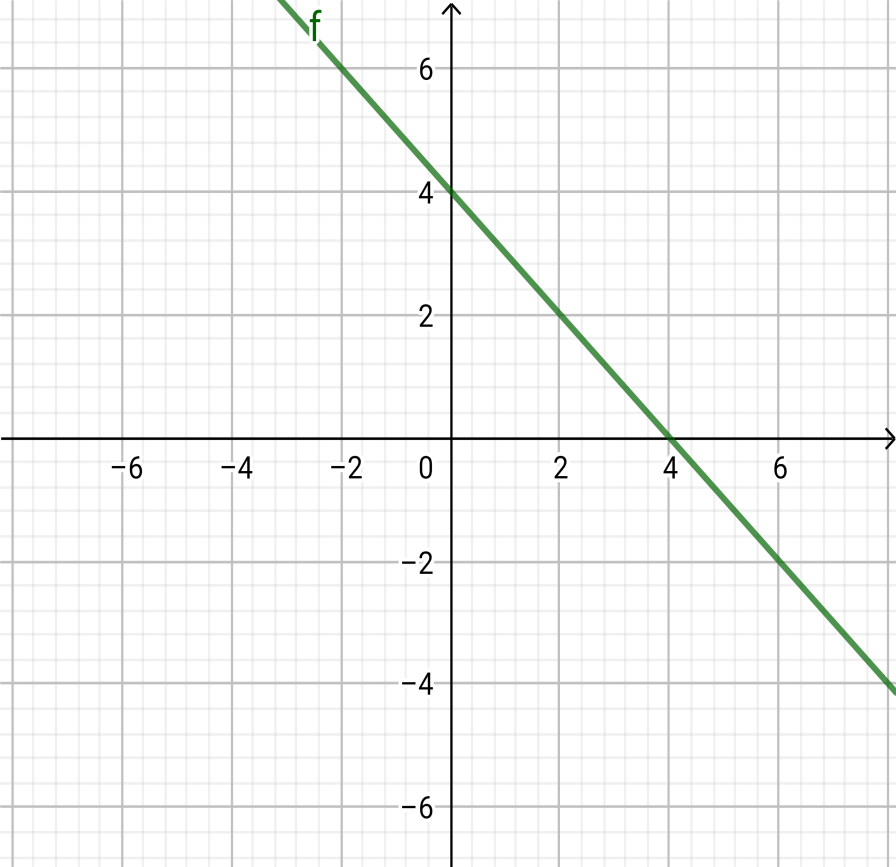
How do you graph the linear function f(x)=−x+4?
Solution
In this question, we are going to solve the function and plot the points in the graph.
First we are going to solve the function for two points.
Next, find the points (x,y) to plot the graph by giving values to x and then find the value of y.
Finally, Plot the points on the coordinate plane we get the required result.
Complete step-by-step solution:
In this question, we are going to solve the function and plot the points in the graph.
First write the given function and mark it as (1)
f(x)=−x+4....(1)
Here we are going to solve the function for two points:
To find the first point: for x=0
⇒f(0)=−0+4
⇒f(0)=4
Thus the required point is (0,4)
To find the second point: for x=4
⇒f(4)=−4+4
⇒f(4)=0
Thus the required point is (4,0)
Therefore the required points are (0,4)and(4,0)
Next we are going to plot those two points on the coordinate plane.
Draw our y-axis as a vertical line and our x-axis as a horizontal line.
Mark the relevant points for the x and y values.
Graph:
Note: Graphs are a common method to visually illustrate relationships in the data.
The purpose of graphs is to present data that are too numerous or complicated to be described adequately in the text and in less space.
We can also solve this function by another method as follows:
We have to find the intercepts, that is where the graph crosses the x and y axes.
Let x=0 in the equation for y-intercept
Let y=0 in the equation for x-intercept
x=0 ⇒y=−0+4
⇒y=4
y=0 ⇒0=−x+4
⇒x=4
Thus the required points are (0,4) and (4,0)
Hence we get the required result.