Question
Question: How do you graph the line \[y = - x + 8\]?...
How do you graph the line y=−x+8?
Solution
A graph of a function f is the set of ordered pairs; the equation of graph is generally represented as y=f(x), where x and f(x) are real numbers. We substitute the value of x and we determine the value of y and then we mark the points in the graph and we join the points.
Complete step-by-step answer:
Here in this question, we have to plot the graph for the given function. A graph of a function is set of ordered pairs and it is represented as y=f(x), where x and f(x) are real numbers. These pairs are in the form of cartesian form and the graph is the two-dimensional graph.
First, we have to find the value of y by using the graph equation y=−x+8. Let we substitute the value of x has -3, -2, -1, 0, 1, 2, and 3.
Now we consider the value of x as -3, the value of y is
Now we consider the value of x as -2, the value of y is
⇒y=−(−2)+8 ⇒y=2+8 ⇒y=10Now we consider the value of x as -1, the value of y is
⇒y=−(−1)+8 ⇒y=1+8 ⇒y=9Now we consider the value of x as 0, the value of y is
⇒y=(0)+8 ⇒y=8Now we consider the value of x as 1, the value of y is
⇒y=−1+8 ⇒y=7Now we consider the value of x as 2, the value of y is
⇒y=−2+8 ⇒y=6Now we consider the value of x as 3, the value of y is
⇒y=−3+8 ⇒y=5Now we draw a table for these values we have
| X | -3 | -2 | -1 | 0 | 1 | 2 | 3 |
|---|---|---|---|---|---|---|---|
| y | 11 | 10 | 9 | 8 | 7 | 6 | 5 |
The graph plotted for this point is represented below:
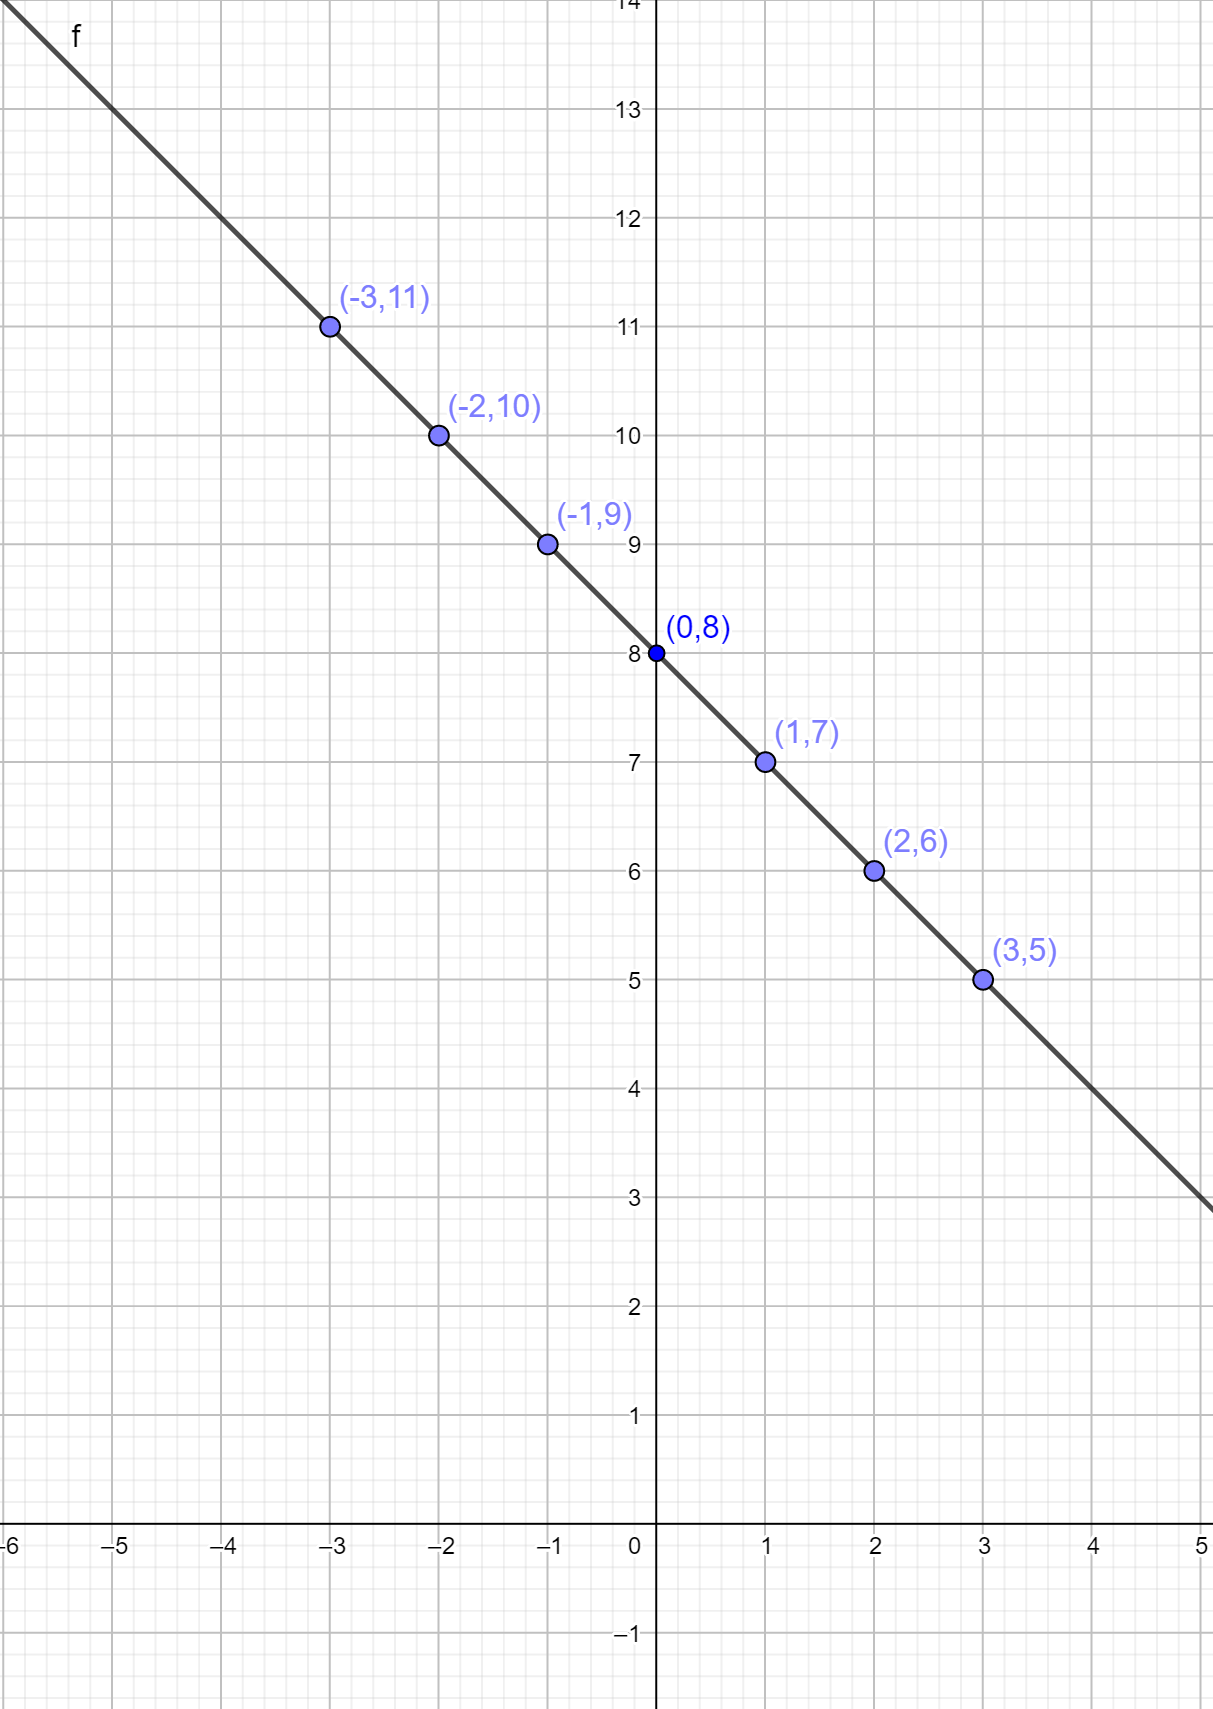
Note: The graph is plotted x-axis versus y axis. The graph is two dimensional. By the equation of a graph, we can plot the graph by assuming the value of x. we can’t assume the value of y. because the value of y depends on the value of x. Hence, we have plotted the graph.