Question
Question: How do you graph the line \(y = - x\) ?...
How do you graph the line y=−x ?
Solution
We know the general equation of a straight line is y=mx+c where m is the gradient and y=c is the value where the line cuts the y− axis. We know about the cartesian coordinates of points which is (x,y) where x is the abscissa and y is the ordinate.
Complete step by step Solution:
Given that – line equation is y=−x
Now we will put values of x=0,1,2,3...... in above equation one by one and get the value of y
Now we will put value x=0in y=−x , we get y=0
Now we will put value x=1 in y=−x , we get y=−1
Now we will put value x=2 in y=−x , we get y=−2
Now we will put value x=3 in y=−x , we get y=−3
Now we will put value x=4 in y=−x , we get y=−4
We got enough points for representing a line of given linear equation y=−x on the graph
Now we will put all point on the graph which we got by putting values of x in equation y=−x which are (0,0),(1,−1),(2,−2),(3,−3),(4,−4)
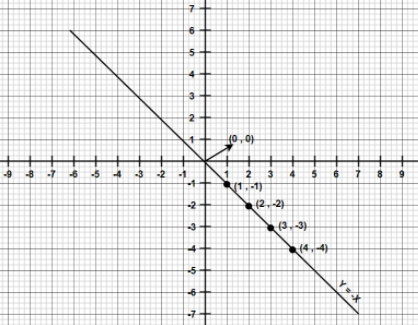
The above graph is the required graph for the given line y=−x
Note:
We know that general equation of line is y=mx+c we can solve above given equation y=−x also by comparing it with y=mx+c then we will get m=−1 then this means that the slope of given line is the below of x−axis axis and right side of y−axis.