Question
Question: How do you graph the line \( y = \sin \left( {3x} \right) \) ?...
How do you graph the line y=sin(3x) ?
Solution
Hint : A graph of a function f is the set of ordered pairs; the equation of graph is generally represented as y=f(x) , where x and f(x) are real numbers. We substitute the value of x and we determine the value of y and then we mark the points in the graph and we join the points.
Complete step-by-step answer :
Here, in the given question, we have to plot the graph for the given function. A graph of a function is a set of ordered pairs and it is represented as y=f(x) , where x and f(x) are real numbers. These pairs are in the form of cartesian form and the graph is the two-dimensional graph.
First, we have to find the value of y by using the graph equation y=sin(3x) .
Let us substitute the value of x as 2π .
⇒y=sin(3×2π)
⇒y=sin(23π)
⇒y=−1
Now we consider the value of x as 3π , the value of y is
⇒y=sin(3×3π)
⇒y=sin(π)
⇒y=0
Now we consider the value of x as (6π) , the value of y is
⇒y=sin(3×6π)
⇒y=sin(2π)
⇒y=1
Now we consider the value of x as 0 , the value of y is
⇒y=sin(3×0)
⇒y=0
Now we draw a table for these values we have
| X | 2π | 3π | (6π) | 0 |
|---|---|---|---|---|
| y | -1 | 0 | 1 | 0 |
We also know the nature of the graph of sine function. Hence, we can now plot the graph of the given function y=sin(3x) . The nature of the graph of a function and its slope can also be determined from the derivative of the function. The graph plotted for these points is represented below:
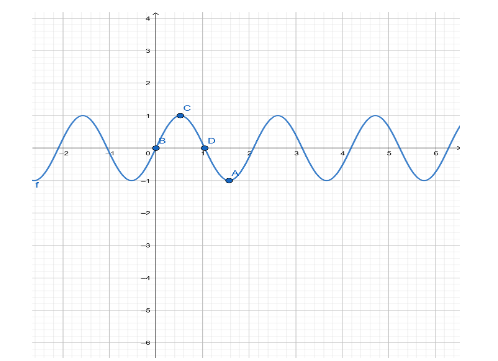
Note : The graph is plotted x-axis versus y axis. The graph is two dimensional. By the equation of a graph, we can plot the graph by assuming the value of x. we can’t assume the value of y. because the value of y depends on the value of x. Hence, we have plotted the graph.