Question
Question: How do you graph the line \[y = - 4x + 4\] ?...
How do you graph the line y=−4x+4 ?
Solution
In the above question, we need to plot the above line on the graph. Since, the given equation is a line where the equation of the straight line is y=mx+cso we can compare with this equation and find out the coordinates of the line on the cartesian plane.
Complete step by step solution:
In the above equation, we have to plot the line on the graph. To find the coordinates of the line what we can do is to select some values of x coordinate and then evaluate those values in the given equation.
So, now we will have to select a value for x i.e., zero and we substitute the value in y=mx+c where m is the slope and c is the constant term y-intercept. So, substitute the value in equation we get,
The equation is y=−4x+4 .So when x=0 we get So when x=0we get,
Therefore, we get the y-intercept as 4. The line will cut the Y-axis at point 4.
Now we will select the point y=0.
Therefore, we get x-intercept as 1. The line will cut x-axis at 1.
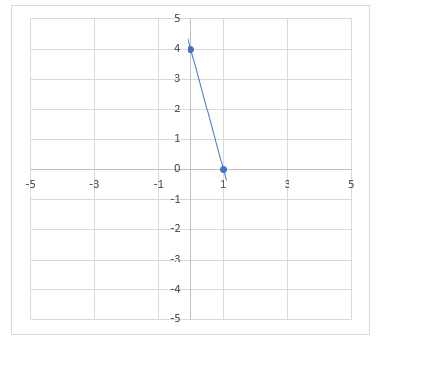
Hence, we plot the points (0,4) and (1,0) on the graph and the line is plotted by joining these points.
Note: An important thing to note is that slope contains the direction in which how you go from one point to another where m=xy=runrise. The numerator tells you many steps to go up and down and the denominator tell us how much steps to move left or right.