Question
Question: How do you graph the line \(y = 4\) ?...
How do you graph the line y=4 ?
Solution
Compare y=4 with slope intercept form y=mx+c where m is slope and c is the y intercept and plot it.
Complete step by step answer:
Slope intercept form of the equation is y=mx+c where m is slope and c is the y intercept.
Comparing y=mx+c with y=4
Here, c is 4.
We get slope, m=0 when slope m=0 then the equation given is a horizontal line.
This means x can take any values.
This means, point (x,y) is (0,4) , (−3,4),(−2,4),(−1,4),(1,4),(2,4),(3,4)....
Here y is constant that is 4.
Mark the points in the graph (0,4) , (−3,4),(−2,4),(−1,4),(1,4),(2,4),(3,4)
After marking join all the points, we get the horizontal line
The horizontal line is parallel to x-axis.
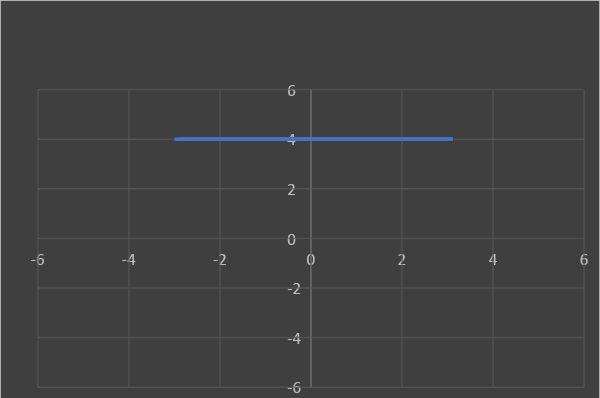
Thus, the above graph represents line y=4.
Additional information:
Any straight line parallel to x-axis is given by y=a where a is the distance of line from the x-axis. Similarly, any straight line parallel to the y-axis is given by x=b where b is the distance of line from the y-axis. When equations like this come you can directly draw a parallel line for the given equation .
Note: One should know the standard equation of line that is, slope intercept form y=mx+c.
where mis slope and c is the y intercept.
Parallel lines are two lines in co - co-ordinate plane, which never intersects each other.
When substituting the value for variable try to list them in a table to make it easier to plot the points.