Question
Question: How do you graph the line \[y = - 3x + 3\]?...
How do you graph the line y=−3x+3?
Solution
Here, we are given a linear equation in two variables. We will substitute different values of x in the given equation to find corresponding values of y. This will give us the coordinate points and using these points we will draw the graph of the given equation.
Complete Step by Step Solution:
We are given an equation of a line-
y=−3x+3……………………………………………………………………………………………..(1)
Now, we will find the coordinates for the given equation of a line.
Now, by substituting x=0 in equation(1) , we get
y=−3(0)+3
⇒y=3
Substituting x=1 in equation (1) , we get
y=−3(1)+3
⇒y=0
The co-ordinates (0,3) and (1,0) are the x-intercept and y -intercept respectively.
Now, by substituting x=2 in equation (1) , we get
y=−3(2)+3
⇒y=−3
Substituting x=3 in equation (1), we get
y=−3(3)+3
⇒y=−6
Now, by substituting x=4 in equation (1), we get
y=−3(4)+3
⇒y=−9
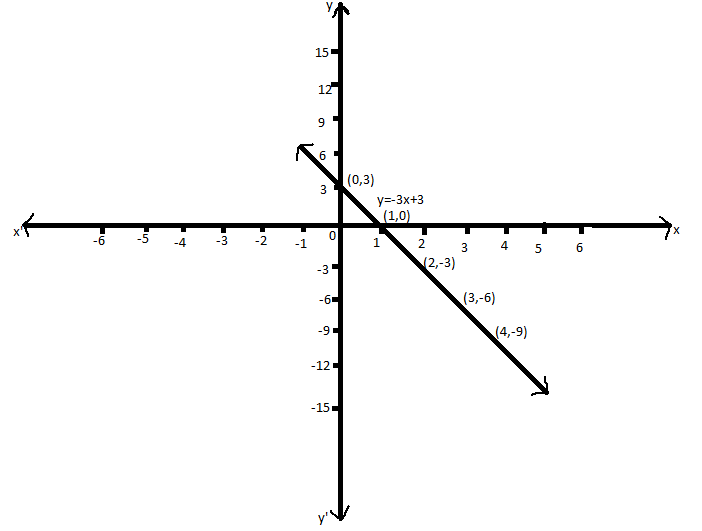
So, the coordinates of the equation of line are (0,3),(1,0) ,(2,−3) ,(3,−6) and (4,−9)
Therefore, the coordinates of the equation of line are (0,3),(1,0) ,(2,−3) ,(3,−6) and (4,−9).
Now, we plot the graph for the co-ordinates, we get
Note:
We will solve the linear equation in two variables by the method of substitution to find the solution set at different points. Thus the solution set becomes the coordinates of the point in the graph for the linear equation. Linear equation in two variables is an equation with the highest power of 1 in two variables. Thus the graph of a linear equation is always a straight line. The given equation of the line is in the slope-intercept formy=mx+c where m is the slope and c is the y-intercept. A point crossing the x-axis is called x-intercept and A point crossing the y-axis is called the y-intercept.