Question
Question: How do you graph the line\(y = - 3\)?...
How do you graph the liney=−3?
Solution
This question is from the topic of graphs. In this question we have to plot the line y=−3. Given the equation of line y=−3 did not have x component. As we know that any equation of line is of the form ax+by=c. To solve this question we will first write this equation in the slope-intercept form of line to find some points which lie on the line y=−3.
Complete step by step answer:
Let us try to solve this question in which we are asked to plot the graph of line y=−3. To plot this graph we will first write the equation of the given line y=−3 in slope-intercept form of line which is y=mx+c. After doing this we will find some points which lie on the line y=−3 with the help of these points we draw the graph. Now, given the equation of the line y=−3 will be written in slope-intercept form as y=0x+(−3).
Given equation slope and intercept are given by m=0 and c=−3.Now, we will find some point which lies on the given equation by putting values of xand yrespectively.
y=0x+(−3) (1)
Let us take x=0 then the value of x in equation(1), we get y=−3.
Similarly, Let us take x=1 then the value of x in equation(1), we get y=−3.
Similarly, Let us take x=2 then the value of x in equation(1), we get y=−3.
Similarly, Let us take x=−1 then value of x in equation(1), we get y=−3.
Similarly, Let us take x=−2 then value of x in equation(1), we get y=−3.Now we have some points which lies on y=−3, here is the graph
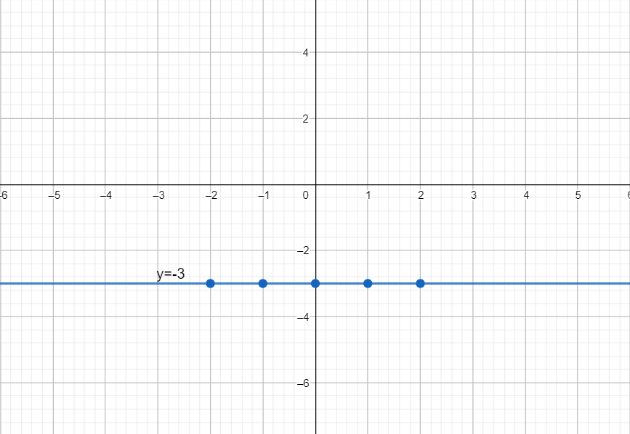
These blue dots on the line are above points which we have used to draw the line.
Note: From the graph of line y=−3 is parallel to x−axis.Questions in which we are asked to plot the graph of a line. First write the given equation of line in slope intercept form. Then find some points which lie on the line.