Question
Question: How do you graph the line \[y = - 2\]?...
How do you graph the line y=−2?
Solution
In the above question, we need to plot the above line on the graph. Since, the given equation is a line where the equation of the straight line is y=mx+c so we can compare with this equation and find out the coordinates of the line on the cartesian plane.
Complete step by step solution:
In the above equation, we have to plot the line on the graph. To find the coordinates of the line what we can do is to select some values of x coordinate and then evaluate those values in the given equation where we get y=−2.
So, we will select a value for x i.e., zero and we substitute the value in y=mx+c
Where m is the slope of the equation and c is the constant term y-intercept. So substitute the value in equation we get,
y=m×0+c
Since, y should always be equal to -2 so we use m=0 because whatever value we put for xwill not matter as long m is zero.
Therefore y=-2 so c becomes -2. Here c is the y-intercept, so y-intercept means the line cutting the y - axis.
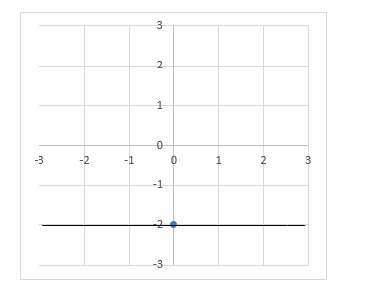
Therefore, the line is parallel to the x-axis because the value of slope is 0. Since it has no slope the line is in horizontal direction cutting the y-axis at point -2.
Note: An important thing to note is that slope contains the direction in which you go from one point to another. where m=xy⇒runrise.The numerator tells you many steps to go up and down and denominator tell us how much steps to move left or right.