Question
Question: How do you graph the line \(x=6\)?...
How do you graph the line x=6?
Solution
In this problem we need to draw a graph for the given expression that is x=6. Now we will assume or write the given equation as x=6+0y. In the above equation we can observe that the variable y is an independent variable and x is the dependent variable. So, we will assume the range of independent variables y from −3 to 3. Now we will calculate the value of x for each value of y and represent them as points in the coordinate system. Now we will join them to get the required plot.
Complete step by step solution:
Given that, x=6.
Let the above equation is written as
x=6+0y
Now we will assuming that the variables y which is in the above we take arbitrary points of y is varies from −3 to3. now the values of y for each value of x can be
| y | −3 | −2 | −1 | 0 | 1 | 2 | 3 |
|---|---|---|---|---|---|---|---|
| x | 6 | 6 | 6 | 6 | 6 | 6 | 6 |
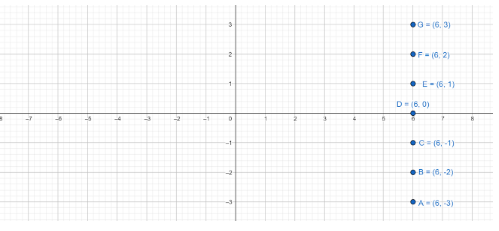
Now the points on the given equation are (6,−3), (6,−2), (6,−1), (6,0), (6,1), (6,2), (6,3).
Now we will mark all points in the graph paper, then we will get,
To draw the graph of the given equation we are going to join the all the points which we have on the graph paper, then we will get
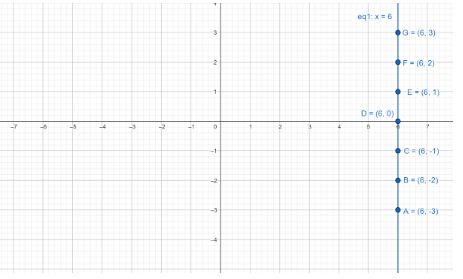
Then the graph of the given equation x=6 is shown in the above diagram.
Note:
We can also directly graph the given equation. We know that the line x=a is a parallel line to the y−axis and passes through the point (a,0). From this data we can plot the graph easily.