Question
Question: How do you graph the line \(-x-3y=2\) ?...
How do you graph the line −x−3y=2 ?
Solution
We know that the equation of a straight line is y = mx + c and we can represent the equation of straight line in another form ax+by=c , we can convert this into y = mx + c where m is the slope of line and c is the y intercept of the straight line.
Complete step by step answer:
The given equation of the line is −x−3y=2
We can draw the graph of the straight line by joining any 2 points which are on the line or satisfy the equation of line
So let’s choose any 2 points which are on the straight line −x−3y=2
Let’s take x equal to 0 so the value of y will be −32
So one point is (0,−32)
For another point let’s take y equal to 0, so the value of x equal to – 2
So another point is (−2,0)
So the graph of −x−3y=2 will joining the points (0,−32) and (−2,0) and extend the line infinitely
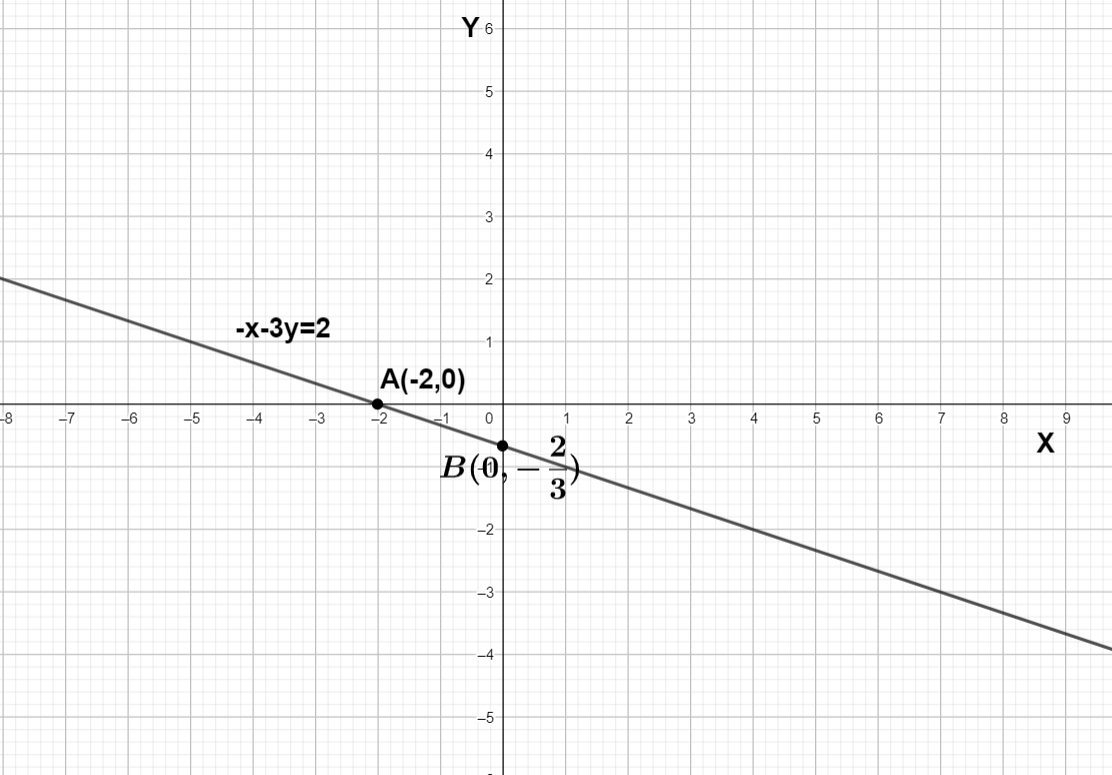
We can see the graph of −x−3y=2 is the straight line joining 2 points A (−2,0) and B (0,−32)
Note:
We can write all the lines in the form y = mx+ c except all the lines which are parallel to the Y axis. The reason behind it is the slope of all the lines which are parallel to the Y axis tends to infinity. The equation of all such lines is x=k where k is a constant.